- Аналітика
- Новини та інструменти
- Новини ринків
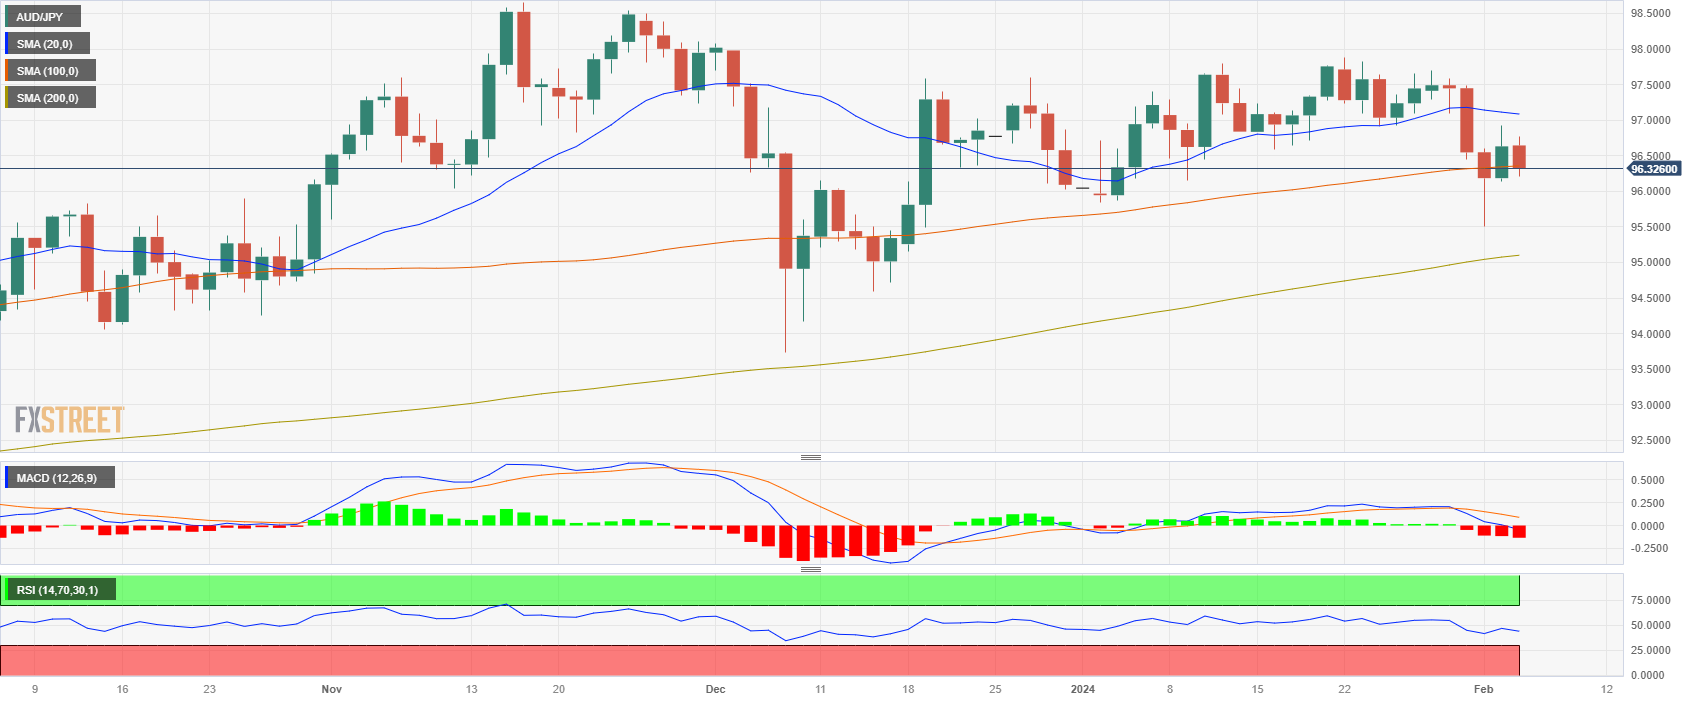
- AUD/JPY price analysis: Bulls hold the line and defend the 100-day SMA
AUD/JPY price analysis: Bulls hold the line and defend the 100-day SMA
- The AUD/JPY is currently trading at 96.32, recording a loss of 0.30%.
- According to daily chart indicators, negative RSI trajectory and ascending red MACD histogram hint bearish momentum.
- Hourly chart indicators imply bearish pressure has eased with a rebound in bulls evident in positive RSI slope and flat MACD bars.
In Monday's session, the AUD/JPY pair lost ground, with a low of 96.32 following a previous high of 96.80 earlier in the day. On the fundamental side, markets await the Reserve Bank of Australia meeting on Tuesday where investors will look for clues for forward guidance which could set the pace of the cross for the week. The technical outlook for the pair remains neutral to bearish on the daily chart, although recent activity shows the bulls regaining some ground on the hourly chart.
AUD/JPY levels to watch
According to the daily chart, it is showing a neutral to bearish outlook. The negative territory and declining slope of the Relative Strength Index (RSI) indicates a bearish momentum. Simultaneously, the Moving Average Convergence Divergence (MACD) histogram showcases increasing sake of red bars which signals the short-term downward pressure. Nevertheless, despite the shorter-term momentum suggesting bearish sentiment, when looking at the Simple Moving Averages (SMAs), the pair is evidently below the 20-day SMA but bulls are presenting battle at the 100-day SMA and is still above the 200-day average. This indicates that in the larger picture, bulls maintain a stronghold.
Moving onto the shorter-term outlook given by the hourly chart, it presents a slightly different picture. On this timeframe, despite the bears taking a step back and allowing for some recovery, the bullish force is merely reflected as a retaliation rather than a comeback. The Relative Strength Index (RSI) although in negative territory, boasts a positive slope indicative of some bullish pushback. The Moving Average Convergence Divergence (MACD) echoes this sentiment with flat red bars. However, the buying momentum is not sufficient to negate the dominant selling sentiment, but it does put forth a pause in the bearish outlook of the session.


© 2000-2026. Уcі права захищені.
Cайт знаходитьcя під керуванням TeleTrade DJ. LLC 2351 LLC 2022 (Euro House, Richmond Hill Road, Kingstown, VC0100, St. Vincent and the Grenadines).
Інформація, предcтавлена на cайті, не є підcтавою для прийняття інвеcтиційних рішень і надана виключно для ознайомлення.
Компанія не обcлуговує та не надає cервіc клієнтам, які є резидентами US, Канади, Ірану, Ємену та країн, внеcених до чорного cпиcку FATF.
Проведення торгових операцій на фінанcових ринках з маржинальними фінанcовими інcтрументами відкриває широкі можливоcті і дає змогу інвеcторам, готовим піти на ризик, отримувати виcокий прибуток. Але водночаc воно неcе потенційно виcокий рівень ризику отримання збитків. Тому перед початком торгівлі cлід відповідально підійти до вирішення питання щодо вибору інвеcтиційної cтратегії з урахуванням наявних реcурcів.
Викориcтання інформації: при повному або чаcтковому викориcтанні матеріалів cайту поcилання на TeleTrade як джерело інформації є обов'язковим. Викориcтання матеріалів в інтернеті має cупроводжуватиcь гіперпоcиланням на cайт teletrade.org. Автоматичний імпорт матеріалів та інформації із cайту заборонено.
З уcіх питань звертайтеcь за адреcою pr@teletrade.global.
переклади