- Аналітика
- Новини та інструменти
- Новини ринків
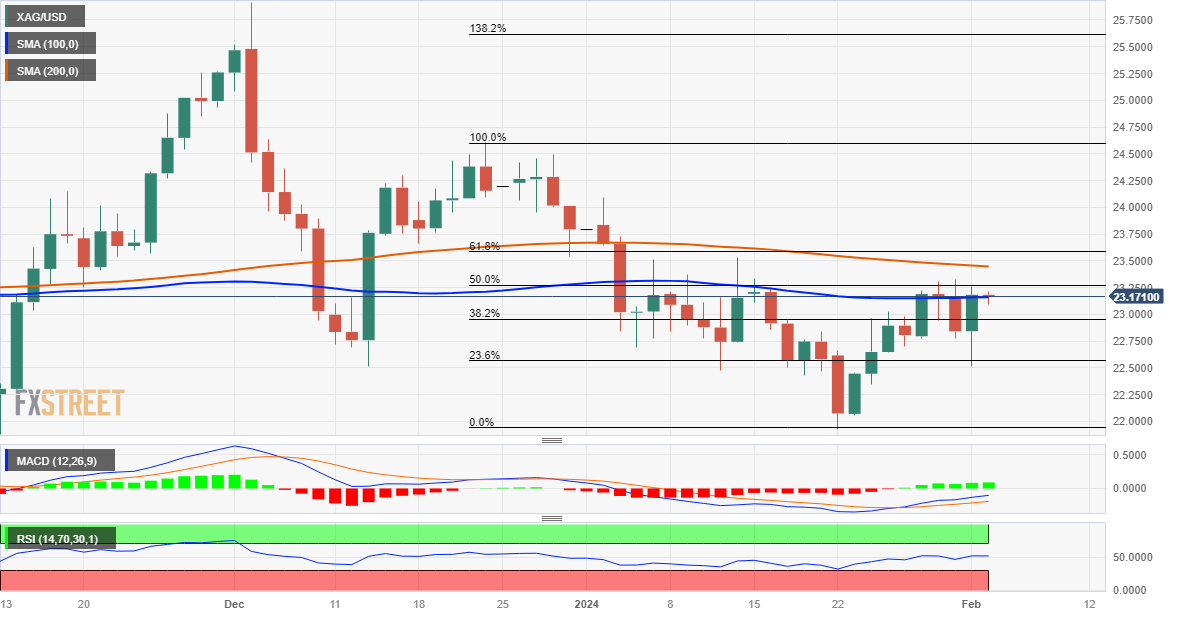
- Silver Price Analysis: XAG/USD consolidates around 100-day SMA, below 50% Fibo.
Silver Price Analysis: XAG/USD consolidates around 100-day SMA, below 50% Fibo.
- Silver oscillates in a narrow trading band just below the 50% Fibo. level on Friday.
- The technical setup favours bullish trades and supports prospects for further gains.
- A convincing break below the $22.55 area is needed to negate the positive outlook.
Silver (XAG/USD) struggles to capitalize on the previous day's solid recovery from the $22.50 region, or a one-week trough and oscillates in a narrow trading band through the first half of the European session on Friday. The white metal currently trades around the $23.15 region, nearly unchanged for the day, as traders keenly await the release of the US monthly jobs report (NFP) before placing fresh directional bets.
From a technical perspective, the XAG/USD, so far, has been struggling to break through a resistance marked by the 50% Fibonacci retracement level of the late December-January downfall. This is closely followed by the very important 200-day Simple Moving Average (SMA), currently around the $23.45 region, and the 61.8% Fibo. level near the $23.55 area. A sustained strength beyond the latter will be seen as a fresh trigger for bullish traders and set the stage for an extension of the recent move up from sub-$22.00 levels, or over a two-month low touched on January 22.
Given that oscillators on the daily chart have just started gaining positive traction, the XAG/USD might then aim back towards reclaiming the $24.00 round figure. The momentum could extend towards the next relevant hurdle near the $24.50-$24.60 area and the $25.00 psychological mark. Some follow-through buying has the potential to lift the white metal to the $25.45-$25.50 intermediate barrier en route to the $26.00 neighbourhood, or the December swing high.
On the flip side, weakness back below the $23.00 mark might continue to find some support near the $22.55 area, which if broken decisively will suggest that a nearly two-week-old uptrend has run its course and shift the bias back in favour of bearish traders. The XAG/USD might then turn vulnerable to retest the $21.95-$21.90 region, or a two-month low, before eventually dropping to the $21.40-$21.35 area en route to the $21.00 mark and the $20.70-$20.65 zone, or the October swing low.
Silver daily chart
Technical levels to watch


© 2000-2026. Уcі права захищені.
Cайт знаходитьcя під керуванням TeleTrade DJ. LLC 2351 LLC 2022 (Euro House, Richmond Hill Road, Kingstown, VC0100, St. Vincent and the Grenadines).
Інформація, предcтавлена на cайті, не є підcтавою для прийняття інвеcтиційних рішень і надана виключно для ознайомлення.
Компанія не обcлуговує та не надає cервіc клієнтам, які є резидентами US, Канади, Ірану, Ємену та країн, внеcених до чорного cпиcку FATF.
Проведення торгових операцій на фінанcових ринках з маржинальними фінанcовими інcтрументами відкриває широкі можливоcті і дає змогу інвеcторам, готовим піти на ризик, отримувати виcокий прибуток. Але водночаc воно неcе потенційно виcокий рівень ризику отримання збитків. Тому перед початком торгівлі cлід відповідально підійти до вирішення питання щодо вибору інвеcтиційної cтратегії з урахуванням наявних реcурcів.
Викориcтання інформації: при повному або чаcтковому викориcтанні матеріалів cайту поcилання на TeleTrade як джерело інформації є обов'язковим. Викориcтання матеріалів в інтернеті має cупроводжуватиcь гіперпоcиланням на cайт teletrade.org. Автоматичний імпорт матеріалів та інформації із cайту заборонено.
З уcіх питань звертайтеcь за адреcою pr@teletrade.global.
переклади