- Аналітика
- Новини та інструменти
- Новини ринків
- Gold Price Forecast: XAU/USD advances despite rising US yields as bears take a breather
Gold Price Forecast: XAU/USD advances despite rising US yields as bears take a breather
- The XAU/USD trades at $2,030 seeing gains of 0.43%.
- Key indicators on the daily chart signal that the bears are catching their breath after last week's strong movements.
- The four-hour chart outlook suggests potential upward bias, with a positive RSI incline and MACD's green bars.
On Tuesday's session, the Gold spot price XAU/USD was spotted trading at $2,030, reflecting a 0.43% gain, as the bears are taking a breather after last week's notable 2% loss. The daily chart presents a neutral-to-bearish sentiment with the bears while, the four-hour indicators are slightly tilted to the upside, suggesting an imminent potential shift in momentum.
Fundamentally speaking, strong US economic data and hawkish sentiments from the Federal Reserve (Fed) have led to significant selling of metals, causing doubts about an impending Fed rate-cutting cycle. In that sense, as markets start to adjust their bets on the Fed, the upside potential for the metal is capped, as it is causing US yields, often seen as the cost of holding non-yielding metals to rise.
XAU/USD technical levels
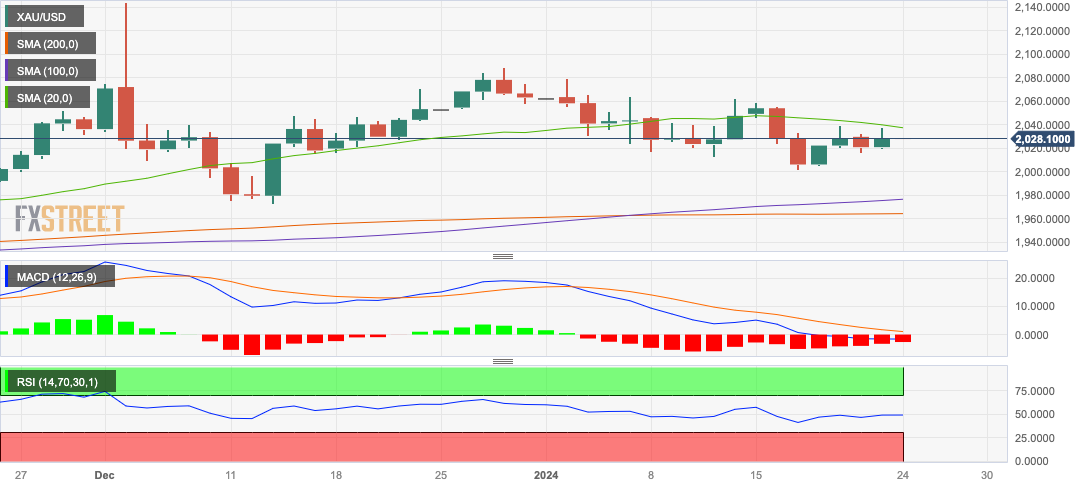
The Relative Strength Index (RSI) on the daily chart is flat on the negative side. The Moving Average Convergence Divergence (MACD) displays an equivalently flat activity with negative red bars evidencing bearish sentiment. Despite this, the metal continues to cling just below the 20-day Simple Moving Average (SMA), while managing to remain above the 100 and 200-day SMAs. The maintaining of a position above the longer-term SMAs underscores a ruling bullish perspective in a broader sense, even amidst the bearish undertones polarizing the immediate scenario, particularly after a 2% loss last week.
Zooming into the four-hour timeframe, the momentum subtly changes. The same indicators remain flat, albeit with a small bias towards a buying sentiment. As per the Relative Strength Index (RSI), it shows positive slope taking place within the positive domain. Concurrently, the Moving Average Convergence Divergence (MACD) reflects a stationary display of red bars.
XAU/USD daily chart


© 2000-2026. Уcі права захищені.
Cайт знаходитьcя під керуванням TeleTrade DJ. LLC 2351 LLC 2022 (Euro House, Richmond Hill Road, Kingstown, VC0100, St. Vincent and the Grenadines).
Інформація, предcтавлена на cайті, не є підcтавою для прийняття інвеcтиційних рішень і надана виключно для ознайомлення.
Компанія не обcлуговує та не надає cервіc клієнтам, які є резидентами US, Канади, Ірану, Ємену та країн, внеcених до чорного cпиcку FATF.
Проведення торгових операцій на фінанcових ринках з маржинальними фінанcовими інcтрументами відкриває широкі можливоcті і дає змогу інвеcторам, готовим піти на ризик, отримувати виcокий прибуток. Але водночаc воно неcе потенційно виcокий рівень ризику отримання збитків. Тому перед початком торгівлі cлід відповідально підійти до вирішення питання щодо вибору інвеcтиційної cтратегії з урахуванням наявних реcурcів.
Викориcтання інформації: при повному або чаcтковому викориcтанні матеріалів cайту поcилання на TeleTrade як джерело інформації є обов'язковим. Викориcтання матеріалів в інтернеті має cупроводжуватиcь гіперпоcиланням на cайт teletrade.org. Автоматичний імпорт матеріалів та інформації із cайту заборонено.
З уcіх питань звертайтеcь за адреcою pr@teletrade.global.
переклади