- Аналітика
- Новини та інструменти
- Новини ринків
- AUD/USD slides amid risk-on impulse ahead of Australia’s Business Confidence
AUD/USD slides amid risk-on impulse ahead of Australia’s Business Confidence
- AUD/USD falls 0.41% this week, slightly below the 200-DMA.
- US economic indicators show mixed signals with a slight improvement in the Leading Economic Index.
- US GDP estimates, Australian NAB Business Confidence, may sway AUD/USD amid economic, inflation worries.
The AUD/USD extends its losses for the second straight day as Tuesday’s Asian session begins, with the pair sliding 0.02%, which added to Monday’s 0.39%, sums a total 0.41% loss in the week. At the time if writing, the pair exchanges hands at 0.6568, after hitting a weekly high of 0.6570.
Bearish technical chart pattern and bad data in Australia, to extend AUD/USD’s losses
Equities in the United States (US) began the week on the right foot, printing all-time highs amid a scarce economic docket in the US. The Conference Board revealed the Leading Economic Index slightly improved in December from -0.5% in November to -0.1% in December, exceeding forecasts for an improvement of -0.3%. According to Justyna Zabinska-La Monica, CB's senior manager of Business Cycle Indicators, there’s “underlying weakness in the US economy,” added that “Despite the overall decline, six out of ten leading indicators made positive contributions to the LEI in December.”
Despite that, the US Dollar Index (DXY), a measure of the buck against six currencies, advances a decent 0.09%, up at 103.32, a headwind for the AUD/USD pair, which formed a bearish technical chart pattern that could open the door for further downside.
Further US economic data is expected, with traders looking for cues to confirm a soft-landing and extend risk-assets rally. The US Commerce Department is scheduled to release the Gross Domestic Product (GDP) for Q4 2023 with estimates circa 2%, down from Q3’s 4.9%.
After that, US unemployment claims and the Fed’s preferred gauge for inflation, the Core Personal Consumption Expenditure (PCE) price index, are foreseen to jump 0.2% MoM and 2.6% YoY.
On the Australian front, the NAB Business confidence would be revealed, an according to ANZ analysts “Conditions may have continued softening in December.” The latest report printed -9, and further softening could mean that the economy would continue to slow down, impacting elevated inflation levels seen at 4.3% in the latest report.
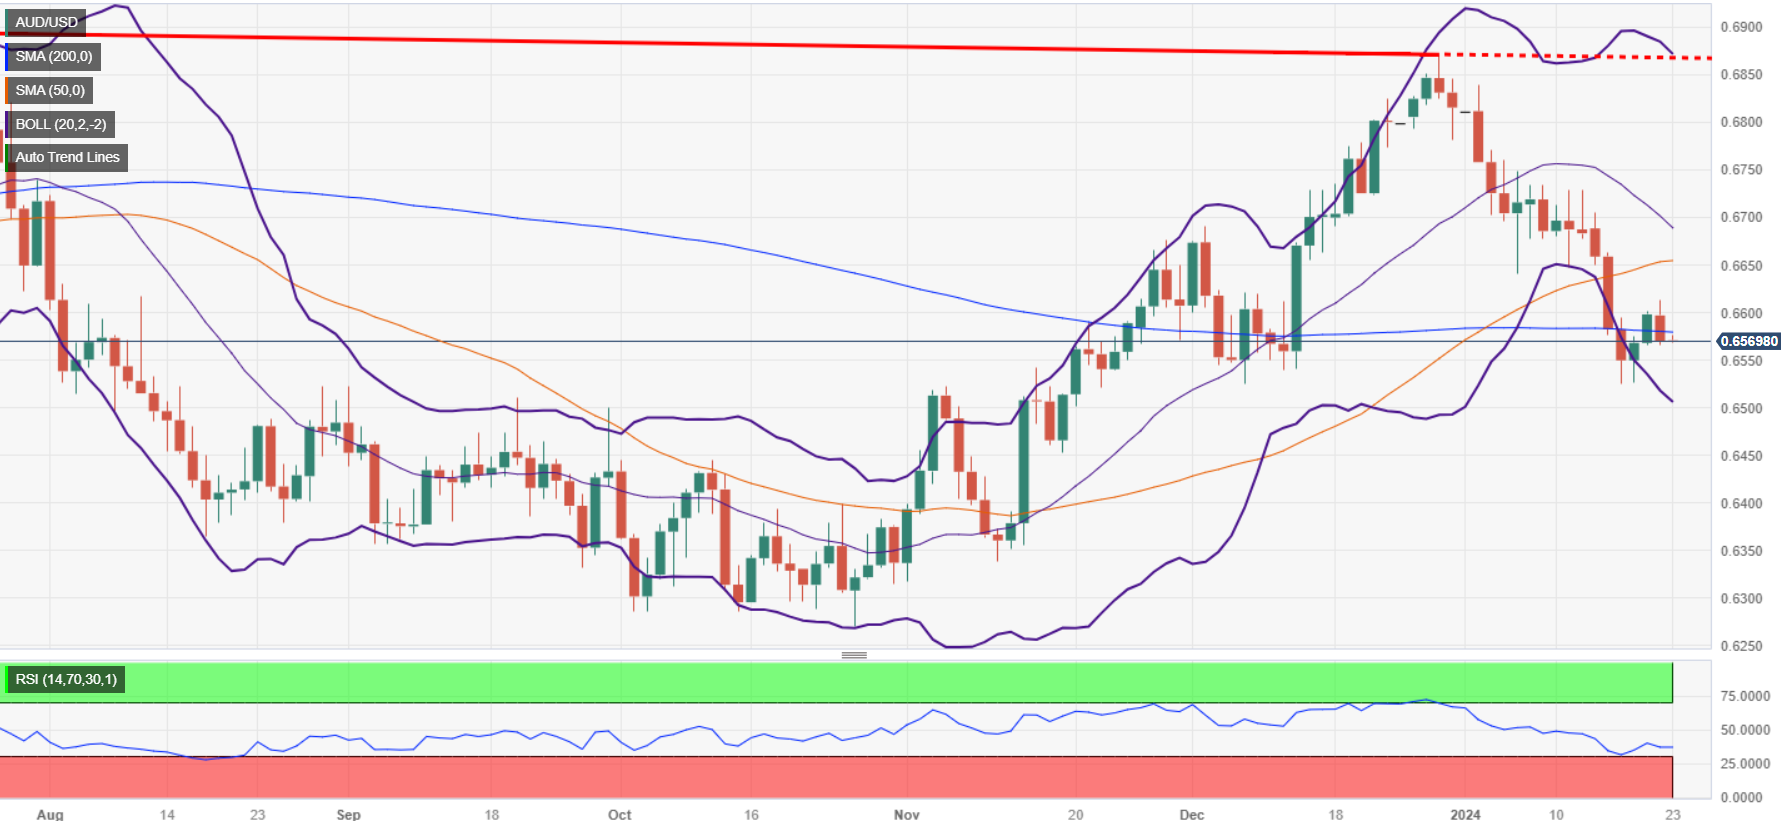
AUD/USD Price Analysis: Technical outlook
After forming a ‘bearish-engulfing’ candle chart pattern, that could open the door for further downside, but AUD/USD sellers must drag prices below the 100-day moving average (DMA) at 0.6516, so they could still hopeful of challenging 0.6500. Further downside is seen at the November 17 low of 0.6452, ahead of major support seen at 0.6338, last year’s November 10 swing low. On the flip side, if buyers step in and push prices above the 200-DMA at 0.6578, that could open the door to challenge 0.6600.


© 2000-2026. Уcі права захищені.
Cайт знаходитьcя під керуванням TeleTrade DJ. LLC 2351 LLC 2022 (Euro House, Richmond Hill Road, Kingstown, VC0100, St. Vincent and the Grenadines).
Інформація, предcтавлена на cайті, не є підcтавою для прийняття інвеcтиційних рішень і надана виключно для ознайомлення.
Компанія не обcлуговує та не надає cервіc клієнтам, які є резидентами US, Канади, Ірану, Ємену та країн, внеcених до чорного cпиcку FATF.
Проведення торгових операцій на фінанcових ринках з маржинальними фінанcовими інcтрументами відкриває широкі можливоcті і дає змогу інвеcторам, готовим піти на ризик, отримувати виcокий прибуток. Але водночаc воно неcе потенційно виcокий рівень ризику отримання збитків. Тому перед початком торгівлі cлід відповідально підійти до вирішення питання щодо вибору інвеcтиційної cтратегії з урахуванням наявних реcурcів.
Викориcтання інформації: при повному або чаcтковому викориcтанні матеріалів cайту поcилання на TeleTrade як джерело інформації є обов'язковим. Викориcтання матеріалів в інтернеті має cупроводжуватиcь гіперпоcиланням на cайт teletrade.org. Автоматичний імпорт матеріалів та інформації із cайту заборонено.
З уcіх питань звертайтеcь за адреcою pr@teletrade.global.
переклади