- Аналітика
- Новини та інструменти
- Новини ринків
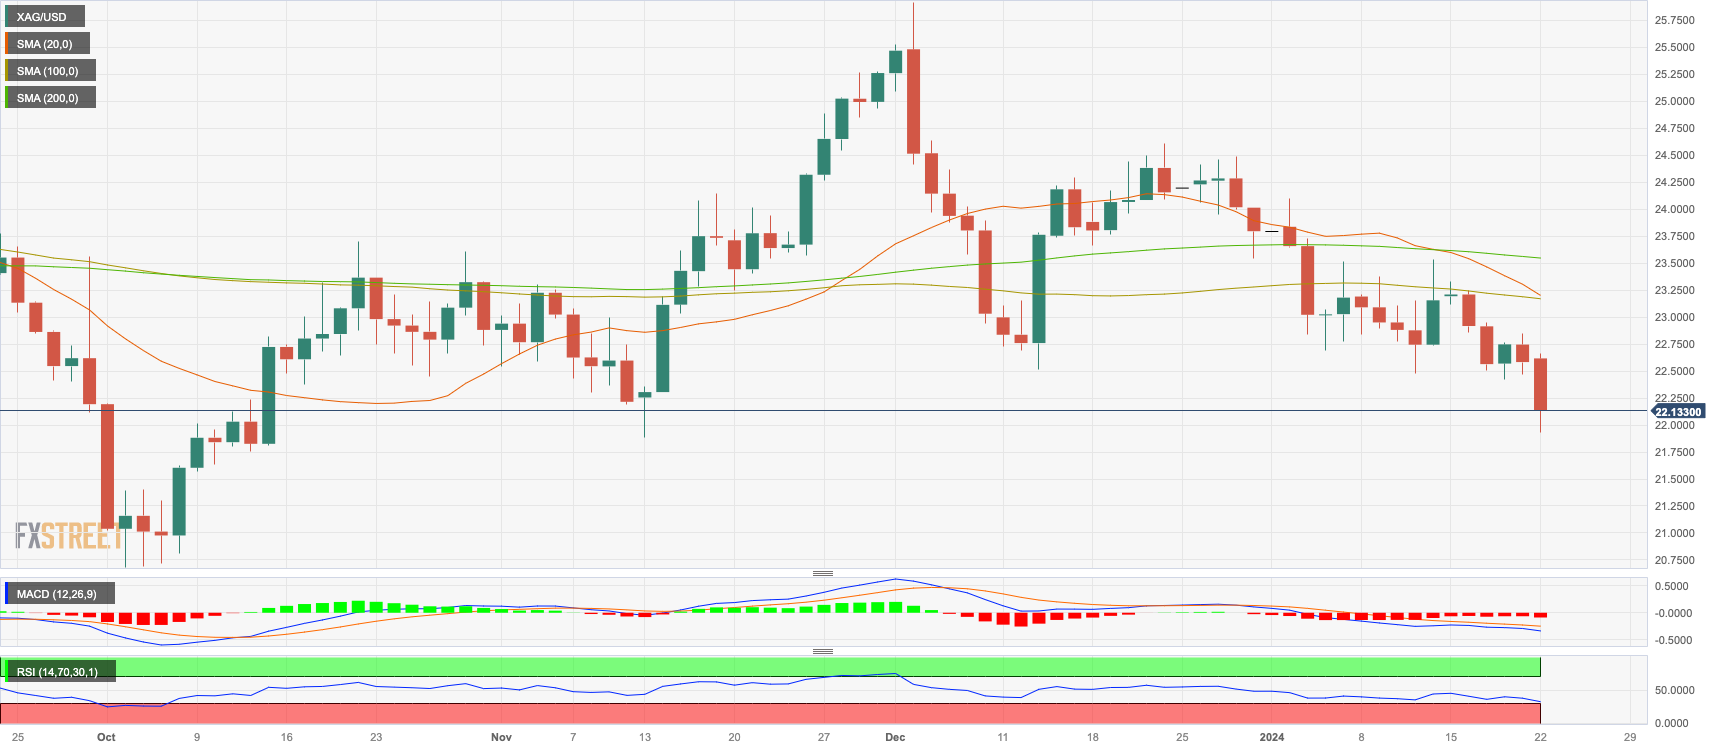
- XAG/USD Price Analysis: Bears advance as markets adjusts dovish bets on the Fed
XAG/USD Price Analysis: Bears advance as markets adjusts dovish bets on the Fed
- The XAG/USD declined to its lowest level since mid-November near $22.20.
- Markets are repricing their bets on the Fed, and the odds of cuts in March decline.
- Despite recovery signals from four-hour chart indicators, the prevailing bearish trend keeps the bulls at bay with the pair positioned under key SMAs.
In Monday's session, the XAG/USD pair is trading at $22.14, showcasing 2% decline, following to multi-month lows. The daily chart paints a largely bearish picture, with selling pressure beginning to assert dominance. The 4-hour technical outlook indicates a recovery from oversold conditions, offering a glimmer of respite in an otherwise downwardly skewed market.
In the meantime, markets are making some adjustments in easing expectations and now, the swaps market is pricing in 125 bp of easing over the course of 2024 vs. nearly 175 bp seen earlier this month while the odds of a cut in March dropped below 50%. However, this seems highly unlikely considering the strength of the US economy. Important upcoming events include key central bank meetings this week and an official Q4 GDP data to be reported on Thursday alongside, Personal Consumption Expenditures (PCE), the Fed’s preferred gauge of inflation, from the last month of 2023. The outcome of this data may shape the expectations from the markets and set the precious metal’s pace for the next sessions.
XAG/USD levels to watch
Analyzing daily chart movements, the technical situation reveals dominance of selling momentum. The Relative Strength Index (RSI) is descending and in a downtrend, signaling an intensification of bearish momentum. Consistent with this, the Moving Average Convergence Divergence (MACD) red bars are on the rise, which also suggests strengthening of bearish momentum. In addition, the pair is trading beneath their 20, 100, and 200-day Simple Moving Averages (SMAs), which confirms that the bears are in control on a broader spectrum, further reinforcing the notion of enhanced bearish momentum.
Moving to the shorter time frame, the four-hour chart suggest thatindicators are correcting oversold conditions, showing some respite for the buyers. Yet, the bearish momentum is too dominant to dismiss. The Relative Strength Index (RSI) continues to descend in the negative territory, lending weight to the bearish bias. In conjection, the Moving Average Convergence Divergence (MACD) reflects rising red bars, yet again indicating increased seller influence.
XAG/USD daily chart


© 2000-2026. Уcі права захищені.
Cайт знаходитьcя під керуванням TeleTrade DJ. LLC 2351 LLC 2022 (Euro House, Richmond Hill Road, Kingstown, VC0100, St. Vincent and the Grenadines).
Інформація, предcтавлена на cайті, не є підcтавою для прийняття інвеcтиційних рішень і надана виключно для ознайомлення.
Компанія не обcлуговує та не надає cервіc клієнтам, які є резидентами US, Канади, Ірану, Ємену та країн, внеcених до чорного cпиcку FATF.
Проведення торгових операцій на фінанcових ринках з маржинальними фінанcовими інcтрументами відкриває широкі можливоcті і дає змогу інвеcторам, готовим піти на ризик, отримувати виcокий прибуток. Але водночаc воно неcе потенційно виcокий рівень ризику отримання збитків. Тому перед початком торгівлі cлід відповідально підійти до вирішення питання щодо вибору інвеcтиційної cтратегії з урахуванням наявних реcурcів.
Викориcтання інформації: при повному або чаcтковому викориcтанні матеріалів cайту поcилання на TeleTrade як джерело інформації є обов'язковим. Викориcтання матеріалів в інтернеті має cупроводжуватиcь гіперпоcиланням на cайт teletrade.org. Автоматичний імпорт матеріалів та інформації із cайту заборонено.
З уcіх питань звертайтеcь за адреcою pr@teletrade.global.
переклади