- Аналітика
- Новини та інструменти
- Новини ринків
- S&P 500 consolidates as US Dollar and yields recover
S&P 500 consolidates as US Dollar and yields recover
- The S&P 500 is flat around 4,785.
- Market expectations of 160 bps easing in 2024 by the Fed ignited the flows to stocks in the last sessions.
- The Index is up by more than 20% in 2023.
In Friday's session, the S&P 500 index stands at 4,785.50 as bullish momentum seems to be flatting in the last trading day of 2023. In that sense, the stock index will close a 24% yearly gain and tallies its ninth consecutive winning week, so downward movements may be on the horizon to consolidate gains.
Recently, capital flows were redirected to stocks as at its final 2023 meeting, the Federal Reserve recognized an inflation deceleration, assuring no rate increases in 2024 and hinting at a 75 bps adjustment. As interest rates and stocks are negatively correlated, the expectations of a less aggressive Fed next year made riskier assets rally.
In the meantime, US yields are consolidating near multi-month lows. The 2-year rate stands at 4.29%, while the 5 and 10-year yields are observed at 3.87%, all three with slight gains and with upward movements seem to limit the upside for the stock index. In addition, the US Dollar measured by the DXY index also recovered and jumped to 101.35, which also presents a challenge to the S&P.
In the first week of 2024, the United States is set to release data related to its employment sector, a critical resource for gauging economic health, which may have an impact on Fed expectations. Those reports include December's Nonfarm Payrrol report, the Average Hourly Earning, and the Unemployment Rate, all closely followed by the Fed.
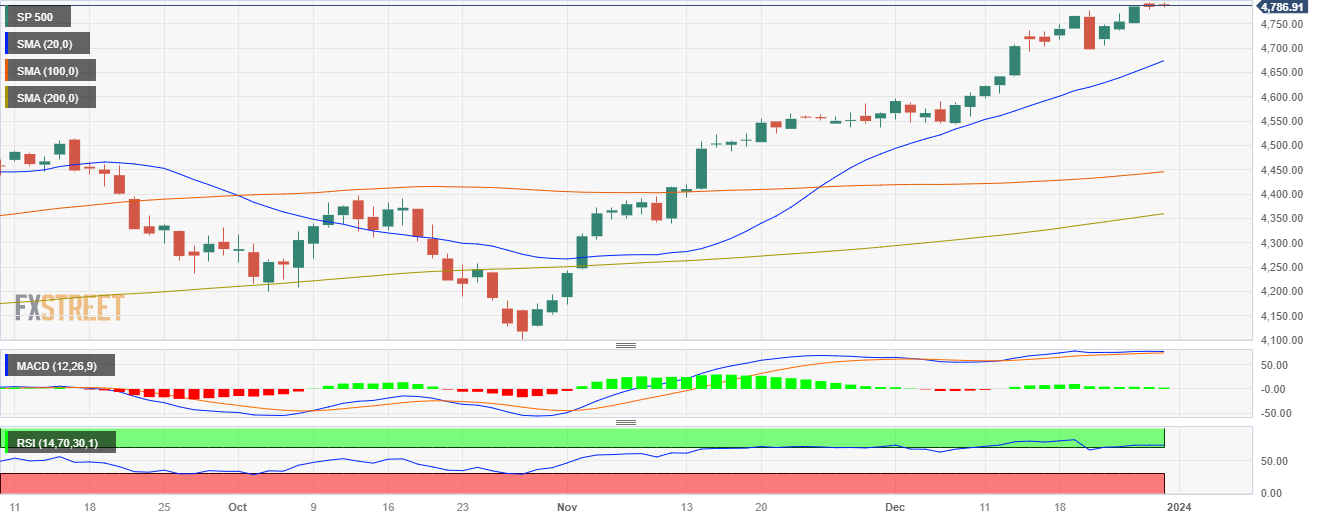
S&P 500 levels to watch
The daily chart indicates a conflict between short- and long-term market forces, precipitating volatile conditions. Evidently, the Relative Strength Index (RSI) presents flat overbought conditions, signaling an impending bearish shift as traders may look to sell to realize their profits. However, the Moving Average Convergence Divergence (MACD) histogram's flat, yet green bars point toward the bulls retaining some of their momentum.
In a broader context, the index's position above the 20, 100, and 200-day Simple Moving Averages (SMAs) mirrors a bullish outlook in the longer term. Despite any short-term fluctuations, the weight of these SMAs suggests that the buying force currently holds significant sway over the index's ongoing trend. Thus, the bullish traction should not be underestimated in the coming trading sessions.
S&P 500 daily chart


© 2000-2026. Уcі права захищені.
Cайт знаходитьcя під керуванням TeleTrade DJ. LLC 2351 LLC 2022 (Euro House, Richmond Hill Road, Kingstown, VC0100, St. Vincent and the Grenadines).
Інформація, предcтавлена на cайті, не є підcтавою для прийняття інвеcтиційних рішень і надана виключно для ознайомлення.
Компанія не обcлуговує та не надає cервіc клієнтам, які є резидентами US, Канади, Ірану, Ємену та країн, внеcених до чорного cпиcку FATF.
Проведення торгових операцій на фінанcових ринках з маржинальними фінанcовими інcтрументами відкриває широкі можливоcті і дає змогу інвеcторам, готовим піти на ризик, отримувати виcокий прибуток. Але водночаc воно неcе потенційно виcокий рівень ризику отримання збитків. Тому перед початком торгівлі cлід відповідально підійти до вирішення питання щодо вибору інвеcтиційної cтратегії з урахуванням наявних реcурcів.
Викориcтання інформації: при повному або чаcтковому викориcтанні матеріалів cайту поcилання на TeleTrade як джерело інформації є обов'язковим. Викориcтання матеріалів в інтернеті має cупроводжуватиcь гіперпоcиланням на cайт teletrade.org. Автоматичний імпорт матеріалів та інформації із cайту заборонено.
З уcіх питань звертайтеcь за адреcою pr@teletrade.global.
переклади