- Аналітика
- Новини та інструменти
- Новини ринків
- AUD/NZD tests 1.0660 as Aussie tumbles across the board
AUD/NZD tests 1.0660 as Aussie tumbles across the board
- The AUD/NZD is down 0.8% on the week as the Aussie backslides.
- The Aussie sees six-week lows against the Kiwi.
- The next target for sellers will be 1.0600.
The AUD/NZD is down five-tenths of a percent from Monday’s opening bids near 1.0875, and the Aussie (AUD) is positioned to be the biggest currency loser of the week, in the red against every other major currency. The Kiwi (NZD) is in a tight race for second place, likewise shedding value across the major currency board, but isn’t able to keep up with the AUD’s declines.
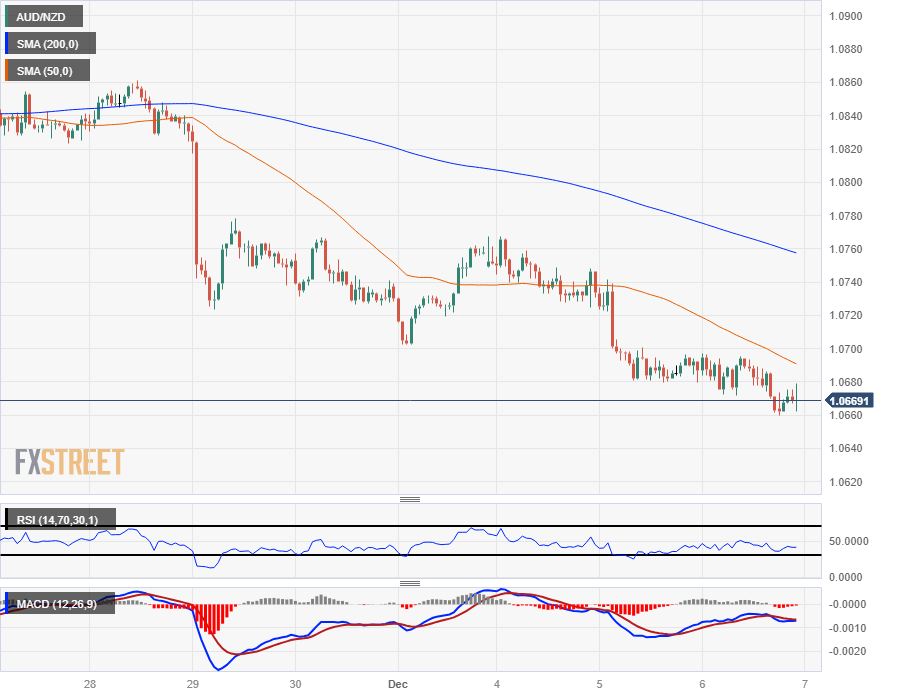
Intraday action sees the AUD/NZD capped by the 50-hour Simple Moving Average (SMA) descending from the 1.0700 handle, with the 200-hour SMA pushing down through 1.0760, and level the AUD/NZD saw a rejection from at the start of the trading week.
The Aussie has closed lower for four of the last six trading sessions, and the near-term floor on bearish momentum will be a support zone priced in from 1.0625 to 1.0650, from early October’s swing low in the price region.
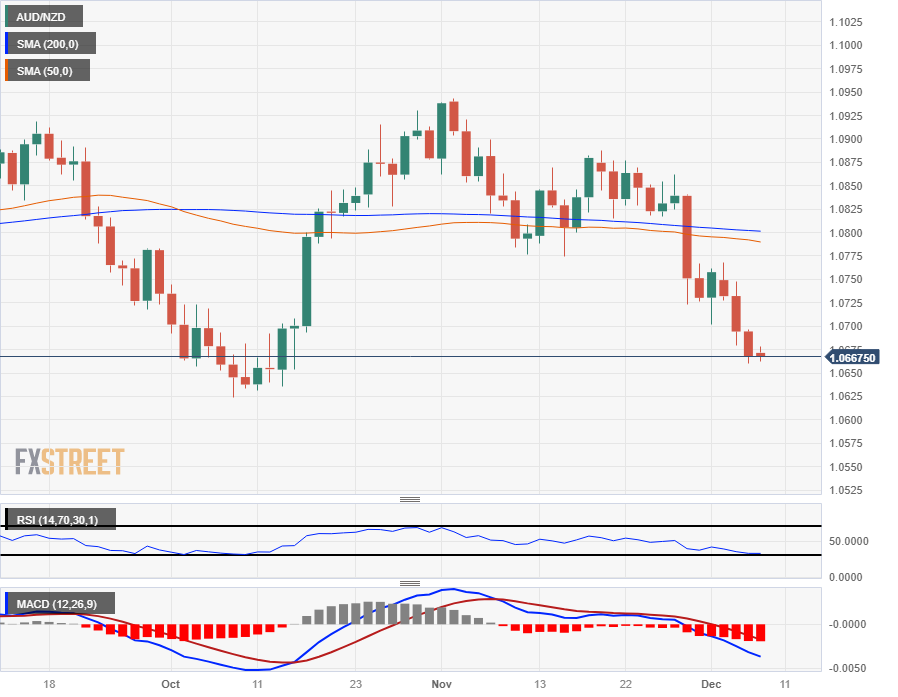
The long-term 200-day SMA continues to drift into the 1.0800 handle, establishing a midrange that the AUD/NZD has cycled around for much of 2023.
Australian Dollar price this week
The table below shows the percentage change of Australian Dollar (AUD) against listed major currencies this week. Australian Dollar was the strongest against the New Zealand Dollar.
| USD | EUR | GBP | CAD | AUD | JPY | NZD | CHF | |
| USD | 1.10% | 1.19% | 0.77% | 1.99% | 0.56% | 1.21% | 0.78% | |
| EUR | -1.12% | 0.11% | -0.33% | 0.91% | -0.56% | 0.13% | -0.32% | |
| GBP | -1.24% | -0.10% | -0.29% | 0.81% | -0.65% | 0.01% | -0.42% | |
| CAD | -0.77% | 0.34% | 0.44% | 1.25% | -0.22% | 0.46% | 0.02% | |
| AUD | -2.04% | -0.92% | -0.81% | -1.24% | -1.48% | -0.79% | -1.26% | |
| JPY | -0.60% | 0.57% | 0.81% | 0.24% | 1.49% | 0.69% | 0.22% | |
| NZD | -1.22% | -0.11% | -0.01% | -0.44% | 0.79% | -0.66% | -0.43% | |
| CHF | -0.80% | 0.32% | 0.42% | -0.01% | 1.24% | -0.21% | 0.43% |
The heat map shows percentage changes of major currencies against each other. The base currency is picked from the left column, while the quote currency is picked from the top row. For example, if you pick the Euro from the left column and move along the horizontal line to the Japanese Yen, the percentage change displayed in the box will represent EUR (base)/JPY (quote).
AUD/NZD Hourly Chart
AUD/NZD Daily Chart
AUD/NZD Technical Levels


© 2000-2026. Уcі права захищені.
Cайт знаходитьcя під керуванням TeleTrade DJ. LLC 2351 LLC 2022 (Euro House, Richmond Hill Road, Kingstown, VC0100, St. Vincent and the Grenadines).
Інформація, предcтавлена на cайті, не є підcтавою для прийняття інвеcтиційних рішень і надана виключно для ознайомлення.
Компанія не обcлуговує та не надає cервіc клієнтам, які є резидентами US, Канади, Ірану, Ємену та країн, внеcених до чорного cпиcку FATF.
Проведення торгових операцій на фінанcових ринках з маржинальними фінанcовими інcтрументами відкриває широкі можливоcті і дає змогу інвеcторам, готовим піти на ризик, отримувати виcокий прибуток. Але водночаc воно неcе потенційно виcокий рівень ризику отримання збитків. Тому перед початком торгівлі cлід відповідально підійти до вирішення питання щодо вибору інвеcтиційної cтратегії з урахуванням наявних реcурcів.
Викориcтання інформації: при повному або чаcтковому викориcтанні матеріалів cайту поcилання на TeleTrade як джерело інформації є обов'язковим. Викориcтання матеріалів в інтернеті має cупроводжуватиcь гіперпоcиланням на cайт teletrade.org. Автоматичний імпорт матеріалів та інформації із cайту заборонено.
З уcіх питань звертайтеcь за адреcою pr@teletrade.global.
переклади