- Аналітика
- Новини та інструменти
- Новини ринків
- AUD/NZD Price Analysis: pinned to near-term lows around 1.0730
AUD/NZD Price Analysis: pinned to near-term lows around 1.0730
- AUD/NZD stuck near 1.0730 as the pair fails to find a reason to bid out of recent lows.
- The Kiwi's strong showing across the FX markets is keeping the Aussie on the backfoot.
- The Kiwi is the strongest performer of the major currencies, in the green against all contenders.
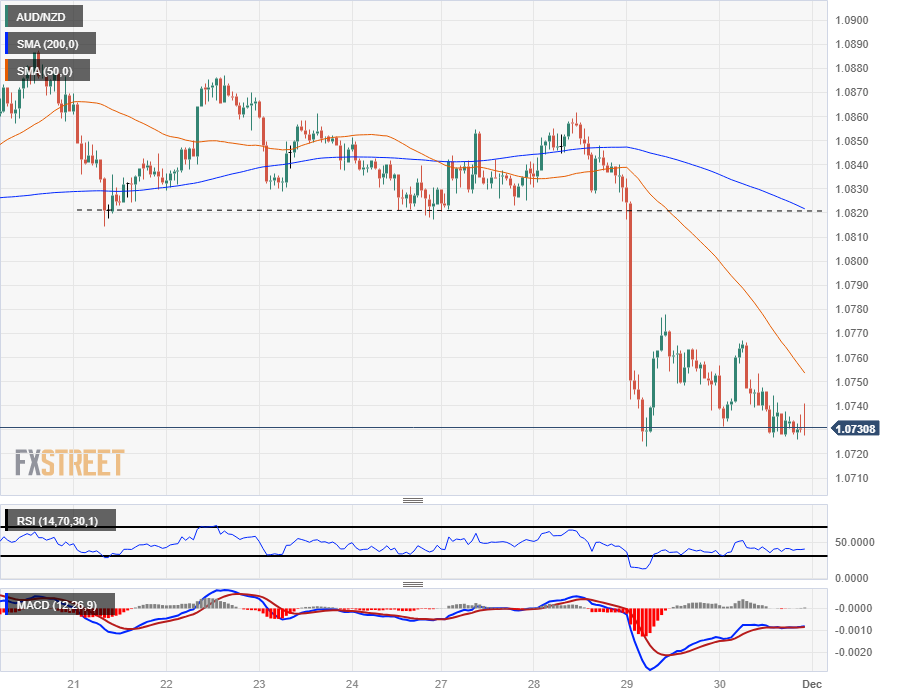
The AUD/NZD is testing into near-term lows around the 1.0730 level as the Aussie (AUD) struggles to find a foothold against the Kiwi (NZD) after a mid-week plunge took the pair down 1.3% from 1.0861 into new lows at 1.0720.
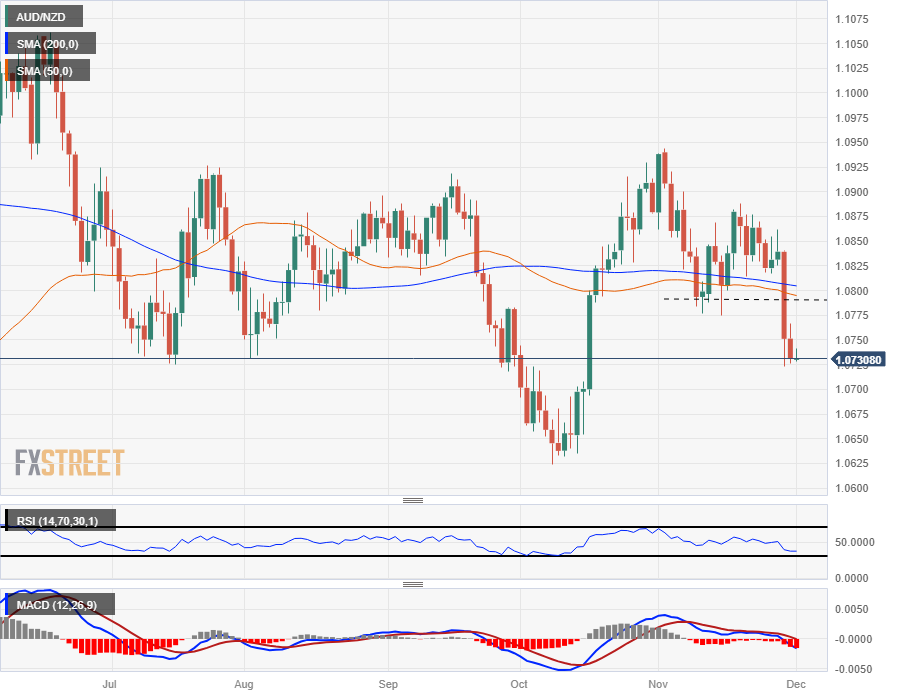
The AUD/NZD's recent backslide took the pair cleanly through the last swing low and the 200-day Simple Moving Average (SMA), both near 1.0800 with the 50-day SMA stuck into the midrange against the longer-term moving average.
The way is open for further declines into 1.0625 at early October's lows, provided sellers can push the pair through technical support from the mid-years low points at 1.0730 which is challenging the current bids.
The Kiwi is the single strongest currency of the majors this week, in the green against the entire major currency bloc from Monday's opening bids.
On the flip side of that, the Aussie sees a mixed showing at best, with the AUD/NZD down nine-tenths of one percent on the week.
Australian Dollar price this week
The table below shows the percentage change of Australian Dollar (AUD) against listed major currencies this week. Australian Dollar was the weakest against the New Zealand Dollar.
| USD | EUR | GBP | CAD | AUD | JPY | NZD | CHF | |
| USD | 0.45% | -0.21% | -0.51% | -0.37% | -0.95% | -1.28% | -0.81% | |
| EUR | -0.45% | -0.67% | -0.97% | -0.84% | -1.40% | -1.74% | -1.27% | |
| GBP | 0.22% | 0.66% | -0.31% | -0.16% | -0.73% | -1.07% | -0.62% | |
| CAD | 0.52% | 0.97% | 0.30% | 0.16% | -0.43% | -0.76% | -0.30% | |
| AUD | 0.39% | 0.84% | 0.18% | -0.12% | -0.55% | -0.88% | -0.41% | |
| JPY | 0.94% | 1.39% | 0.65% | 0.45% | 0.58% | -0.32% | 0.12% | |
| NZD | 1.27% | 1.71% | 1.04% | 0.75% | 0.89% | 0.34% | 0.45% | |
| CHF | 0.82% | 1.26% | 0.60% | 0.30% | 0.44% | -0.13% | -0.46% |
The heat map shows percentage changes of major currencies against each other. The base currency is picked from the left column, while the quote currency is picked from the top row. For example, if you pick the Euro from the left column and move along the horizontal line to the Japanese Yen, the percentage change displayed in the box will represent EUR (base)/JPY (quote).
AUD/NZD Hourly Chart
AUD/NZD Daily Chart
AUD/NZD Technical Levels


© 2000-2026. Уcі права захищені.
Cайт знаходитьcя під керуванням TeleTrade DJ. LLC 2351 LLC 2022 (Euro House, Richmond Hill Road, Kingstown, VC0100, St. Vincent and the Grenadines).
Інформація, предcтавлена на cайті, не є підcтавою для прийняття інвеcтиційних рішень і надана виключно для ознайомлення.
Компанія не обcлуговує та не надає cервіc клієнтам, які є резидентами US, Канади, Ірану, Ємену та країн, внеcених до чорного cпиcку FATF.
Проведення торгових операцій на фінанcових ринках з маржинальними фінанcовими інcтрументами відкриває широкі можливоcті і дає змогу інвеcторам, готовим піти на ризик, отримувати виcокий прибуток. Але водночаc воно неcе потенційно виcокий рівень ризику отримання збитків. Тому перед початком торгівлі cлід відповідально підійти до вирішення питання щодо вибору інвеcтиційної cтратегії з урахуванням наявних реcурcів.
Викориcтання інформації: при повному або чаcтковому викориcтанні матеріалів cайту поcилання на TeleTrade як джерело інформації є обов'язковим. Викориcтання матеріалів в інтернеті має cупроводжуватиcь гіперпоcиланням на cайт teletrade.org. Автоматичний імпорт матеріалів та інформації із cайту заборонено.
З уcіх питань звертайтеcь за адреcою pr@teletrade.global.
переклади