- Аналітика
- Новини та інструменти
- Новини ринків
- AUD/NZD Price Analysis: Aussie rising into technical resistance directly above 1.0840
AUD/NZD Price Analysis: Aussie rising into technical resistance directly above 1.0840
- The AUD/NZD pair continues to grind into heavy congestion, trapped near long-term midranges.
- Intraday action on the AUD/NZD is leaning towards the downside as the pair sees a mild bearish drift.
- The 200-day SMA is proving too strong a magnet for the AUD/NZD to pull away from.
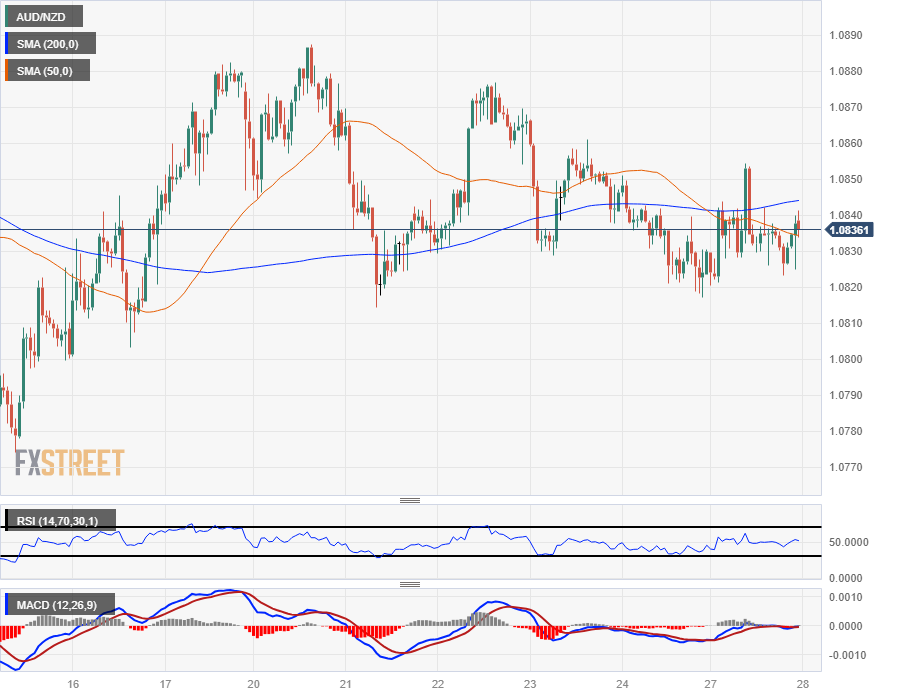
The AUD/NZD is up for the week after climbing a scant one-tenth of a percent on Monday, but bullish momentum remains constrained on the hourly chart by the 200-hour Simple Moving Average (SMA) and a lower-highs pattern on the intraday charts from last week's peak at 1.0887.
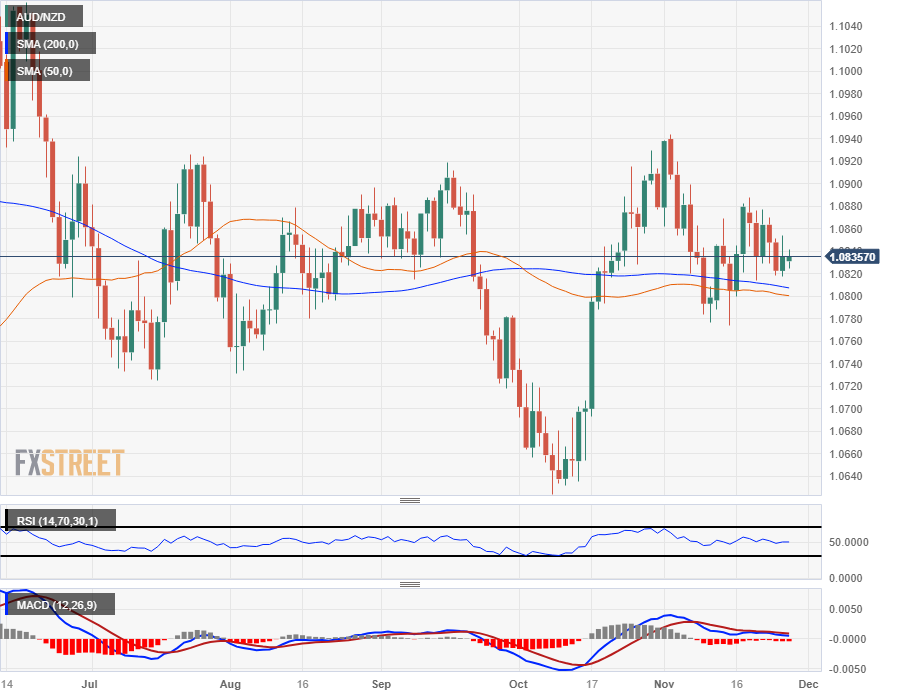
The Aussie (AUD) tipped into a fresh low near 1.0820 against the Kiwi (NZD) late last Friday, and Monday's action saw the pair clawing back losses, but topside momentum remains limited. The pair is catching technical support from the 200-day SMA drifting towards 1.0800, with the 50-day SMA drifting lower in tandem with the longer moving average.
Near-term directional momentum has fully evaporated out of the pair as technical indicators drift into their midranges. The Relative Strength Index (RSI) is flatlining near the 50.0 level, and the Moving Average Convergence-Divergence (MACD) is seeing the fast and slow moving averages waffle into the middle histogram.
Australian Dollar price this week
The table below shows the percentage change of Australian Dollar (AUD) against listed major currencies this week. Australian Dollar was the strongest against the US Dollar.
| USD | EUR | GBP | CAD | AUD | JPY | NZD | CHF | |
| USD | -0.14% | -0.24% | -0.12% | -0.39% | -0.67% | -0.32% | -0.23% | |
| EUR | 0.15% | -0.09% | 0.03% | -0.22% | -0.51% | -0.17% | -0.09% | |
| GBP | 0.24% | 0.10% | 0.09% | -0.15% | -0.45% | -0.10% | -0.01% | |
| CAD | 0.12% | -0.02% | -0.12% | -0.25% | -0.56% | -0.20% | -0.11% | |
| AUD | 0.38% | 0.24% | 0.13% | 0.26% | -0.30% | 0.06% | 0.15% | |
| JPY | 0.66% | 0.52% | 0.36% | 0.54% | 0.29% | 0.34% | 0.43% | |
| NZD | 0.32% | 0.18% | 0.08% | 0.22% | -0.05% | -0.35% | 0.10% | |
| CHF | 0.24% | 0.10% | 0.00% | 0.12% | -0.13% | -0.43% | -0.08% |
The heat map shows percentage changes of major currencies against each other. The base currency is picked from the left column, while the quote currency is picked from the top row. For example, if you pick the Euro from the left column and move along the horizontal line to the Japanese Yen, the percentage change displayed in the box will represent EUR (base)/JPY (quote).
AUD/NZD Hourly Chart
AUD/NZD Daily Chart
AUD/NZD Technical Levels


© 2000-2026. Уcі права захищені.
Cайт знаходитьcя під керуванням TeleTrade DJ. LLC 2351 LLC 2022 (Euro House, Richmond Hill Road, Kingstown, VC0100, St. Vincent and the Grenadines).
Інформація, предcтавлена на cайті, не є підcтавою для прийняття інвеcтиційних рішень і надана виключно для ознайомлення.
Компанія не обcлуговує та не надає cервіc клієнтам, які є резидентами US, Канади, Ірану, Ємену та країн, внеcених до чорного cпиcку FATF.
Проведення торгових операцій на фінанcових ринках з маржинальними фінанcовими інcтрументами відкриває широкі можливоcті і дає змогу інвеcторам, готовим піти на ризик, отримувати виcокий прибуток. Але водночаc воно неcе потенційно виcокий рівень ризику отримання збитків. Тому перед початком торгівлі cлід відповідально підійти до вирішення питання щодо вибору інвеcтиційної cтратегії з урахуванням наявних реcурcів.
Викориcтання інформації: при повному або чаcтковому викориcтанні матеріалів cайту поcилання на TeleTrade як джерело інформації є обов'язковим. Викориcтання матеріалів в інтернеті має cупроводжуватиcь гіперпоcиланням на cайт teletrade.org. Автоматичний імпорт матеріалів та інформації із cайту заборонено.
З уcіх питань звертайтеcь за адреcою pr@teletrade.global.
переклади