- Аналітика
- Новини та інструменти
- Новини ринків
- S&P 500 enters correction territory, ending Friday just shy of $4,100
S&P 500 enters correction territory, ending Friday just shy of $4,100
- The S&P 500 is extending declines into a two-week stretch, down over 5% for the period.
- S&P index down over 10% from the July peak at $4,600, enters correction territory.
- US Equities mixed on Friday as recession fears, lopsided earnings reports drag on stocks.
The Standard & Poor's index marked in the second losing week in a row, entering correction territory after falling 10% from July's high near $4,600.
The S&P 500 index closed Friday down around 20 points, shedding half a percent close out at $4,117.37, with the Dow Jones Industrial Average sinking over 366 points to shed 1.12%, closing Friday at $32417.59.
The NASDAQ Composite index bucked the bearish trend for Friday, closing up 47.41 points to end the day up almost 0.4%, closing at $12,643 plus one penny.
Equities got pushed broadly lower as inflation continues to remain a sticky problem for the Federal Reserve (Fed), with the US Personal Consumption Expenditure (PCE) Index showed consumer price spending rise by its fastest month-on-month pace since May, with the annual PCE cooling slightly into September, bringing "higher for longer" interest rate concerns back to the forefront.
The Fed is slated for another rate call next Wednesday, and while money markets are pricing in an expected rate hold next week, odds of an additional rate hike at December are steadily rising as the US economy remains firm compared to global competitors and inflation remains stubbornly higher than expected.
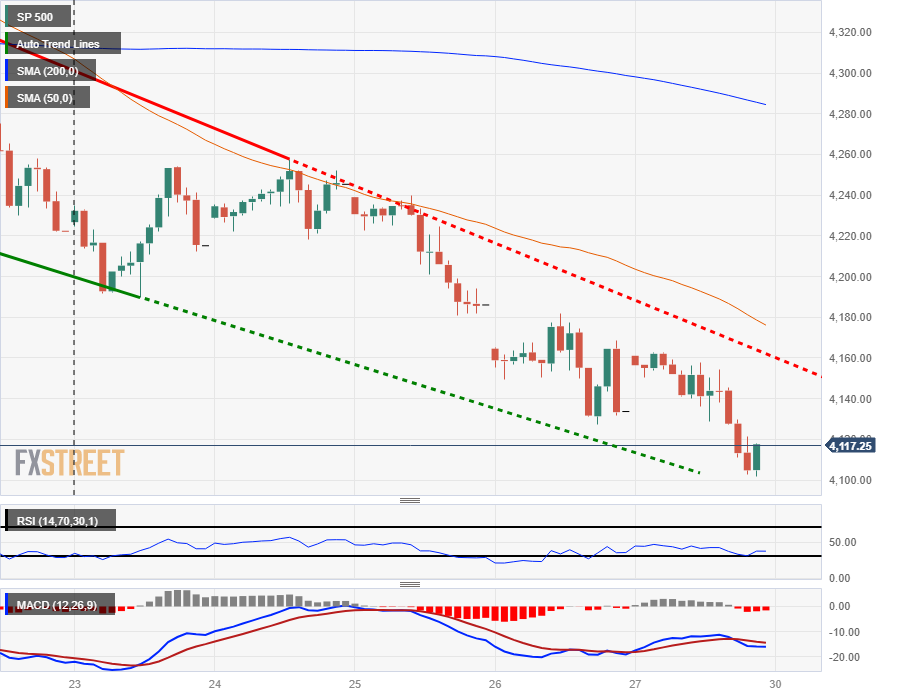
S&P Technical Outlook
The S&P stopped just short of slipping back into $4,100 in Friday's mostly bearish trading, and the major equity index continues to backslide, entering correction territory from July's peaks, and the S&P has locked in two consecutive weeks of red on the charts.
Daily candlesticks have tumbled past the 200-day Simple Moving Average (SMA) as bearish momentum firms up on the chart paper, and the last swing high into $4,400 sees added technical resistance from the 50-day SMA, currently settling into $4,350.
S&P Hourly Chart
S&P Technical Levels


© 2000-2026. Уcі права захищені.
Cайт знаходитьcя під керуванням TeleTrade DJ. LLC 2351 LLC 2022 (Euro House, Richmond Hill Road, Kingstown, VC0100, St. Vincent and the Grenadines).
Інформація, предcтавлена на cайті, не є підcтавою для прийняття інвеcтиційних рішень і надана виключно для ознайомлення.
Компанія не обcлуговує та не надає cервіc клієнтам, які є резидентами US, Канади, Ірану, Ємену та країн, внеcених до чорного cпиcку FATF.
Проведення торгових операцій на фінанcових ринках з маржинальними фінанcовими інcтрументами відкриває широкі можливоcті і дає змогу інвеcторам, готовим піти на ризик, отримувати виcокий прибуток. Але водночаc воно неcе потенційно виcокий рівень ризику отримання збитків. Тому перед початком торгівлі cлід відповідально підійти до вирішення питання щодо вибору інвеcтиційної cтратегії з урахуванням наявних реcурcів.
Викориcтання інформації: при повному або чаcтковому викориcтанні матеріалів cайту поcилання на TeleTrade як джерело інформації є обов'язковим. Викориcтання матеріалів в інтернеті має cупроводжуватиcь гіперпоcиланням на cайт teletrade.org. Автоматичний імпорт матеріалів та інформації із cайту заборонено.
З уcіх питань звертайтеcь за адреcою pr@teletrade.global.
переклади