- Аналітика
- Новини та інструменти
- Новини ринків
- USD/SGD declines below the 20-day SMA as the USD weakens
USD/SGD declines below the 20-day SMA as the USD weakens
- USD/SGD trades below 1.3700 with 0.20 daily losses.
- Inflation in Singapore came in slightly lower than expected.
- The US Dollar trades soft ahead of high-tier economic figures to be released this week.
The USD/SGD declined in Monday's session, mainly driven by the Greenback trading weak against its rivals amid dovish bets on the Federal Reserve (Fed) and lower US Treasury yields. The SGD managed to hold its foot despite lower-than-expected inflation data released during the Asian session, and the focus shifts to key economic activity figures from the US to be released during the week. The economic calendar had nothing relevant to offer on Monday.
The Consumer Price Index (CPI) from Singapore from September came in at 4.1% YoY, lower than the 4.2% YoY expected but accelerated from its last figure of 4.2% YoY.
On the US side, it trades softs as market speculations lean towards a less aggressive approach by the Federal Reserve (Fed) following Chair Powell's speech last week. In his address, Powell emphasised the need to consider the elevated bond yields and stressed the importance of cautious actions in the next decisions. In that sense, the CME FedWatch tool indicates minimal probabilities, currently at approximately 30%, for a 25 basis points hike in the December meeting, which has led to a decline in interest in the US dollar.
On the data front, the US will release the S&P Manufacturing PMI from October on Tuesday, followed by the Q3 Gross Domestic Product (GDP) on Thursday and the Core Personal Consumption Expenditures from September on Friday.
USD/SGD Levels to watch
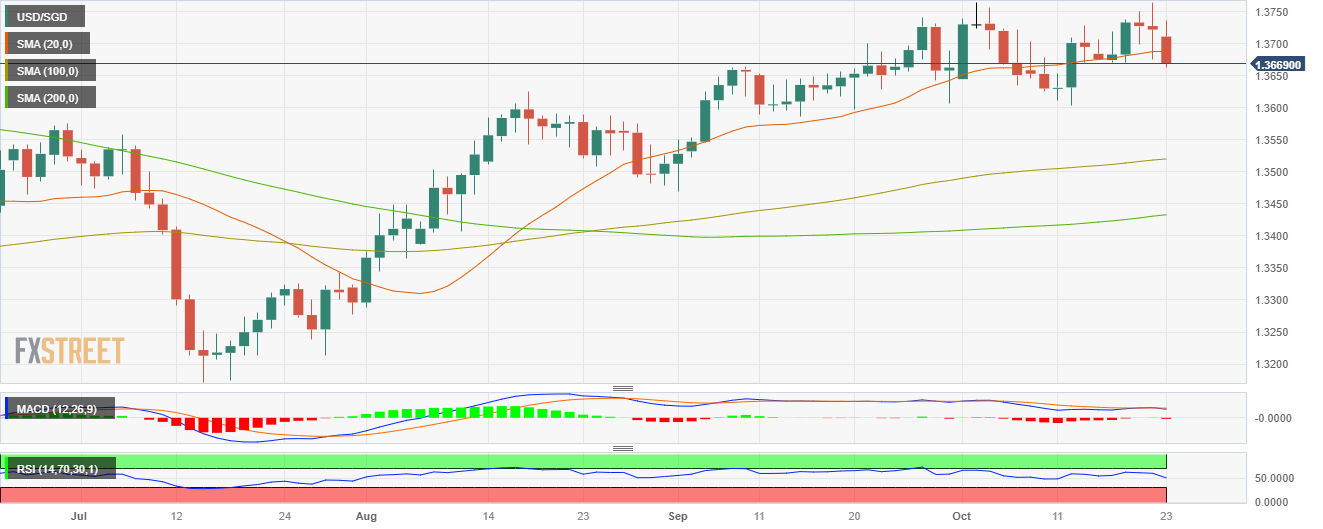
Analysing the daily chart, USD/SGD exhibits signs of bullish exhaustion, contributing to a neutral to bearish technical perspective. The Relative Strength Index (RSI) displays a negative slope in the bullish territory, hinting at a potential shift in momentum, while the Moving Average Convergence (MACD) shows flat green bars. However, the pair is above the 100 and 200-day Simple Moving Average (SMA), highlighting the continued dominance of bulls on the broader scale.
Support levels:1.3660, 1.3650, 1.3630.
Resistance levels: 1.3690 (20-day SMA), 1.3740, 1.3770, 1.3800.
USD/SGD Daily chart


© 2000-2026. Уcі права захищені.
Cайт знаходитьcя під керуванням TeleTrade DJ. LLC 2351 LLC 2022 (Euro House, Richmond Hill Road, Kingstown, VC0100, St. Vincent and the Grenadines).
Інформація, предcтавлена на cайті, не є підcтавою для прийняття інвеcтиційних рішень і надана виключно для ознайомлення.
Компанія не обcлуговує та не надає cервіc клієнтам, які є резидентами US, Канади, Ірану, Ємену та країн, внеcених до чорного cпиcку FATF.
Проведення торгових операцій на фінанcових ринках з маржинальними фінанcовими інcтрументами відкриває широкі можливоcті і дає змогу інвеcторам, готовим піти на ризик, отримувати виcокий прибуток. Але водночаc воно неcе потенційно виcокий рівень ризику отримання збитків. Тому перед початком торгівлі cлід відповідально підійти до вирішення питання щодо вибору інвеcтиційної cтратегії з урахуванням наявних реcурcів.
Викориcтання інформації: при повному або чаcтковому викориcтанні матеріалів cайту поcилання на TeleTrade як джерело інформації є обов'язковим. Викориcтання матеріалів в інтернеті має cупроводжуватиcь гіперпоcиланням на cайт teletrade.org. Автоматичний імпорт матеріалів та інформації із cайту заборонено.
З уcіх питань звертайтеcь за адреcою pr@teletrade.global.
переклади