- Аналітика
- Новини та інструменти
- Новини ринків
- USD/MXN Price Analysis: Sits near two-week high/38.2% Fibo., bullish potential intact
USD/MXN Price Analysis: Sits near two-week high/38.2% Fibo., bullish potential intact
- USD/MXN is seen oscillating in a range on Friday and consolidating its weekly gains.
- The technical setup favours bullish traders and supports prospects for additional gains.
- Any meaningful corrective slide could attract some dip-buying and remain cushioned.
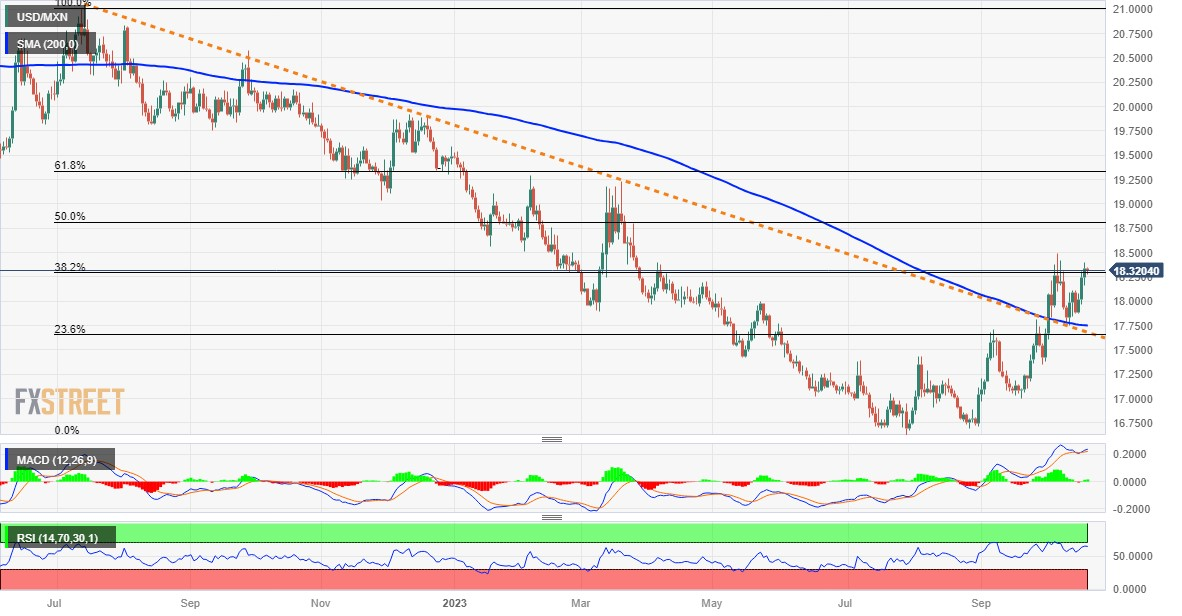
The USD/MXN pair struggles to capitalize on its weekly gains registered over the past three days and seesaws between tepid gains/minor losses through the Asian session on Friday. Spot prices currently trade around the 18.3185 region, down less than 0.10% for the day, and remain well within the striking distance of a near two-week high touched on Thursday.
From a technical perspective, the USD/MXN last week bounced off the 17.7550-17.7545 confluence resistance-turned-support – comprising the 200-day Simple Moving Average (SMA) and a multi-month-old descending trend-line. The subsequent move up, along with positive oscillators on the daily chart, favours bullish traders and suggests that the path of least resistance for spot prices is to the upside.
That said, it will still be prudent to wait for some follow-through buying beyond the 18.4935 area, or the highest level since late March touched earlier this month, before placing fresh bullish bets. The USD/MXN pair might then climb further towards the 18.8145-18.8150 region, representing the 50% Fibonacci retracement level of the fall witnessed in July, which if cleared will set the stage for additional gains.
On the flip side, any corrective slide might now find decent support near the 18.1100 level. This is followed by the 18.0000 mark, below which the USD/MXN pair could retest the weekly low, around the 17.8720-17.8715 region. Some follow-through selling will expose the 200-day SMA support, currently pegged around the 17.7425 zone, before spot prices drop to the 23.6% Fibo. level, around the 17.6595-17.6590 area.
The latter coincides with the aforementioned descending trend-line resistance breakpoint and should act as a key pivotal point. A convincing break below will shift the near-term bias back in favour of bearish traders and make the USD/MXN pair vulnerable to weaken further.
USD.MXN daily chart
Technical levels to watch


© 2000-2026. Уcі права захищені.
Cайт знаходитьcя під керуванням TeleTrade DJ. LLC 2351 LLC 2022 (Euro House, Richmond Hill Road, Kingstown, VC0100, St. Vincent and the Grenadines).
Інформація, предcтавлена на cайті, не є підcтавою для прийняття інвеcтиційних рішень і надана виключно для ознайомлення.
Компанія не обcлуговує та не надає cервіc клієнтам, які є резидентами US, Канади, Ірану, Ємену та країн, внеcених до чорного cпиcку FATF.
Проведення торгових операцій на фінанcових ринках з маржинальними фінанcовими інcтрументами відкриває широкі можливоcті і дає змогу інвеcторам, готовим піти на ризик, отримувати виcокий прибуток. Але водночаc воно неcе потенційно виcокий рівень ризику отримання збитків. Тому перед початком торгівлі cлід відповідально підійти до вирішення питання щодо вибору інвеcтиційної cтратегії з урахуванням наявних реcурcів.
Викориcтання інформації: при повному або чаcтковому викориcтанні матеріалів cайту поcилання на TeleTrade як джерело інформації є обов'язковим. Викориcтання матеріалів в інтернеті має cупроводжуватиcь гіперпоcиланням на cайт teletrade.org. Автоматичний імпорт матеріалів та інформації із cайту заборонено.
З уcіх питань звертайтеcь за адреcою pr@teletrade.global.
переклади