- Аналітика
- Новини та інструменти
- Новини ринків
- S&P 500 declines to $4,278 as US Treasury yields surge once more
S&P 500 declines to $4,278 as US Treasury yields surge once more
- The S&P 500 fell on Thursday alongside broad US equity indexes as investors pulled back.
- US Treasury yields continue to climb, 10-year T-note reaches 4.996%.
- Wall Street was hoping for a firmer dovish showing from Fed head Powell.
The Standard & Poor's (S&P) 500 equity index shed 36.60 points to close down 0.85% at $4,278 on Thursday after stock traders were snubbed by Federal Reserve (Fed) Chairman Jerome Powell, who failed to meet dovish expectations on the Fed's rate outlook, while US Treasury yields continue to climb into highs not seen in over a decade.
The 10-year Treasury note hit a yield of 4.996%, its highest in sixteen years since last crossing the 5% yield mark back in February of 2007.
Fed head Jerome Powell gave moderately dovish comments while speaking at the Economic Club of New York, noting that policy remains tight but the Fed remains ready to act if inflationary pressures reappear. The policy-based statements threw a wrench into equity markets as investors were hoping for a firmly dovish showing from the Fed.
Jerome Powell says higher bond yields are producing tighter financial conditions
Money markets are pricing in a 97% chance of no rate hikes from the Fed at their next rate call, but Wall Street is hoping for indications that the US central bank will accelerate future rate cuts, currently expected some time in the second half of 2024.
Across the US equity boards, the Dow Jones Industrial Average (DJIA) fell 250.91 points to close down 0.75% at $33,414.17, while the tech-heavy NASDAQ Composite tumbled just shy of a full percent, losing 128.13 points to close at $13,186.18, down 0.96%.
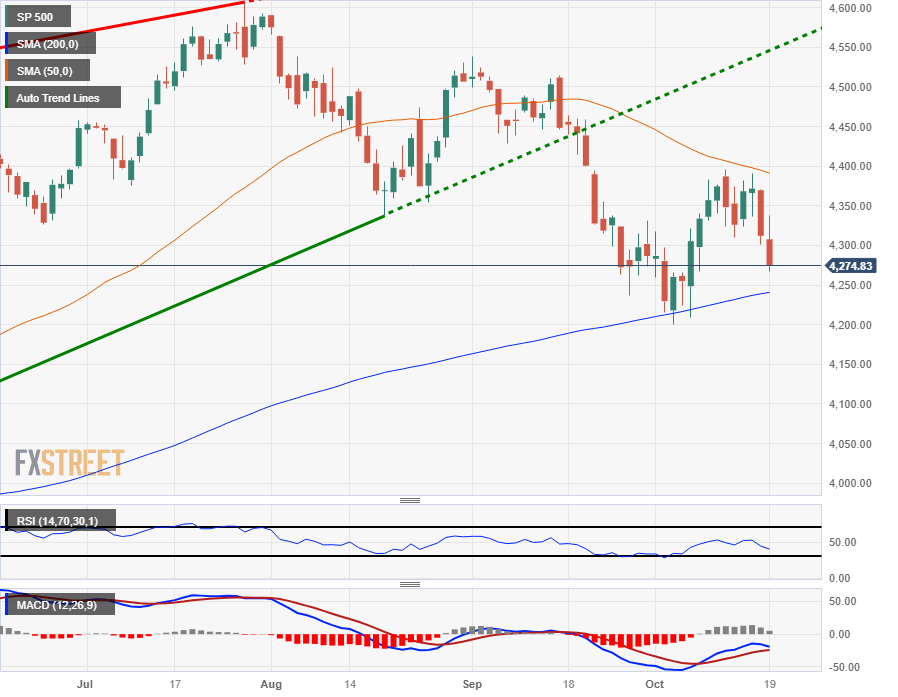
S&P 500 Technical Outlook
The S&P's Thursday slide extends a bearish turnaround from the $4,400 level, and setting up for a near-term challenge of the 200-day Simple Moving Average (SMA) currently rising into the $4,250 chart region.
With the 50-day SMA descending on price action from above, technical charts are set to be constrained until sufficient momentum can be built up for a significant break in either direction.
The S&P remains incredibly well-bid for 2023, but downside pressure is mounting as successive lower highs drag down upside potential.
S&P 500 Daily Chart
S&P 500 Technical Levels


© 2000-2026. Уcі права захищені.
Cайт знаходитьcя під керуванням TeleTrade DJ. LLC 2351 LLC 2022 (Euro House, Richmond Hill Road, Kingstown, VC0100, St. Vincent and the Grenadines).
Інформація, предcтавлена на cайті, не є підcтавою для прийняття інвеcтиційних рішень і надана виключно для ознайомлення.
Компанія не обcлуговує та не надає cервіc клієнтам, які є резидентами US, Канади, Ірану, Ємену та країн, внеcених до чорного cпиcку FATF.
Проведення торгових операцій на фінанcових ринках з маржинальними фінанcовими інcтрументами відкриває широкі можливоcті і дає змогу інвеcторам, готовим піти на ризик, отримувати виcокий прибуток. Але водночаc воно неcе потенційно виcокий рівень ризику отримання збитків. Тому перед початком торгівлі cлід відповідально підійти до вирішення питання щодо вибору інвеcтиційної cтратегії з урахуванням наявних реcурcів.
Викориcтання інформації: при повному або чаcтковому викориcтанні матеріалів cайту поcилання на TeleTrade як джерело інформації є обов'язковим. Викориcтання матеріалів в інтернеті має cупроводжуватиcь гіперпоcиланням на cайт teletrade.org. Автоматичний імпорт матеріалів та інформації із cайту заборонено.
З уcіх питань звертайтеcь за адреcою pr@teletrade.global.
переклади