- Аналітика
- Новини та інструменти
- Новини ринків
- USD/MXN Price Analysis: Bears flirt with 17.80 confluence resistance-turned-support
USD/MXN Price Analysis: Bears flirt with 17.80 confluence resistance-turned-support
- USD/MXN oscillates in a narrow trading band near a one-week trough touched on Wednesday.
- The mixed technical setup warrants caution for bears and before positioning for deeper losses.
- A sustained strngth beyond the 38.2% Fibo. level will set the stage for some maningful upside.
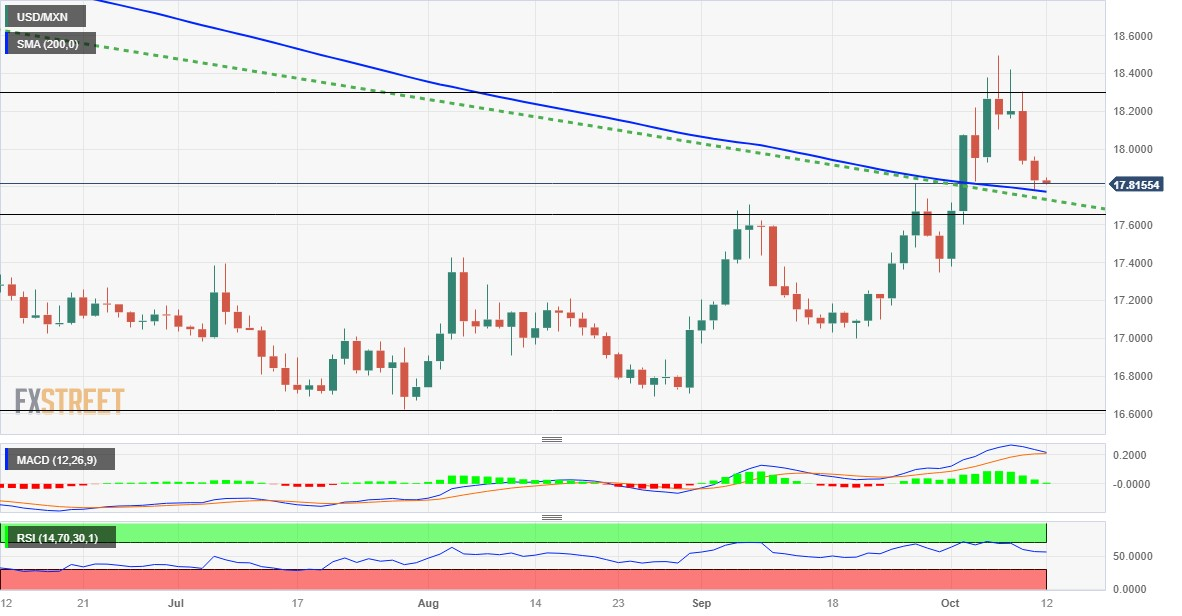
The USD/MXN pair trades on the backfoot during the Asian session on Wednesday and consolidates its recent losses to over a one-week low touched the previous day. Spot prices currently trade around the 17.80 region, down 0.10% for the day, flirting with a confluence resistance breakpoint comprising the 200-day Simple Moving Average (SMA) and a multi-month-old descending trend-line.
Meanwhile, technical indicators on the daily chart have been retreating from higher levels, though manage to hold in the positive territory. This makes it prudent to wait for a convincing break below the aforementioned resistance-turned-support before positioning for an extension of the recent pullback from mid-18.00s, or the highest level since late March touched last week. Some follow-through selling below the 17.65 zone, representing the 23.6% Fibonacci retracement level of the fall witnessed in July, will shift the near-term bias for the USD/MXN pair back in favour of bearish traders.
Spot prices might then accelerate the fall to the 17.40-17.35 horizontal support before dropping further towards the 17.15-17.10 intermediate support. The downward trajectory could get extended and drag the USD/MXN pair to the 16.90-16.85 area and the multi-year low, around the 16.65-16.60 region touched in July.
On the flip side, the 18.00 round figure now seems to act as an immediate hurdle ahead of the 18.15-18.20 zone. This is followed by 38.2% Fibo., around the 18.30 region and mid-18.00s, or the monthly. A sustained strength beyond will set the stage for the resumption of the recent appreciating move witnessed over the past month or so and lift the USD/MXN pair to the 18.80-18.85 area, representing 50% Fibo. level.
USD/MXN daily chart
Techincal levels to watch


© 2000-2026. Уcі права захищені.
Cайт знаходитьcя під керуванням TeleTrade DJ. LLC 2351 LLC 2022 (Euro House, Richmond Hill Road, Kingstown, VC0100, St. Vincent and the Grenadines).
Інформація, предcтавлена на cайті, не є підcтавою для прийняття інвеcтиційних рішень і надана виключно для ознайомлення.
Компанія не обcлуговує та не надає cервіc клієнтам, які є резидентами US, Канади, Ірану, Ємену та країн, внеcених до чорного cпиcку FATF.
Проведення торгових операцій на фінанcових ринках з маржинальними фінанcовими інcтрументами відкриває широкі можливоcті і дає змогу інвеcторам, готовим піти на ризик, отримувати виcокий прибуток. Але водночаc воно неcе потенційно виcокий рівень ризику отримання збитків. Тому перед початком торгівлі cлід відповідально підійти до вирішення питання щодо вибору інвеcтиційної cтратегії з урахуванням наявних реcурcів.
Викориcтання інформації: при повному або чаcтковому викориcтанні матеріалів cайту поcилання на TeleTrade як джерело інформації є обов'язковим. Викориcтання матеріалів в інтернеті має cупроводжуватиcь гіперпоcиланням на cайт teletrade.org. Автоматичний імпорт матеріалів та інформації із cайту заборонено.
З уcіх питань звертайтеcь за адреcою pr@teletrade.global.
переклади