- Аналітика
- Новини та інструменти
- Новини ринків
- DXY fails to hold momentum, declines near 106.00
DXY fails to hold momentum, declines near 106.00
- DXY initially rose to 106.60 and then settled near 106.05.
- Fed’s Logan words contributed to a significant increase in US bond yields.
- Focus shifts to FOMC minutes on Wednesday and Thursday’s inflation figures from the US.
In Monday’s session, the DXY index declined for a fourth consecutive day towards the 106.05 area after rising to a daily high of 106.60 earlier in the session. In line with that, the index continues consolidating the gains, which took it to a multi-month high of 107.35 last week, driven by high US Treasury yields and expectations of a more aggressive Federal Reserve (Fed).
Data-wise, investors are still assessing last Friday’s Nonfarm Payroll report, which saw job creation accelerating in September as well as the unemployment rate while wage inflation decelerated. Markets will now set their sight on Wednesday’s Federal Open Market Committee (FOMC) minutes of the September meeting and, on Thursday, the Consumer Price Index (CPI) figures from the US to continue modelling their expectations regarding the Fed’s next steps.
That being said, Lorie Logan from the Fed showed a dovish stance on Monday and stated that there may be “less need” for continuing hiking, which caused short-term US Treasury yields to decline to multi-week lows. In that sense, the US Dollar faced selling pressure, but hawkish clues on the FOMC minutes or hot inflation reading may reignite the Greenback’s momentum as the Fed has clearly stated that their stance is still data-dependant.
In addition, the escalation of the conflict between Israel and the Hamas terrorist group in the Middle East may boost demand for the USD as investors may take refuge in it.
DXY Levels to watch
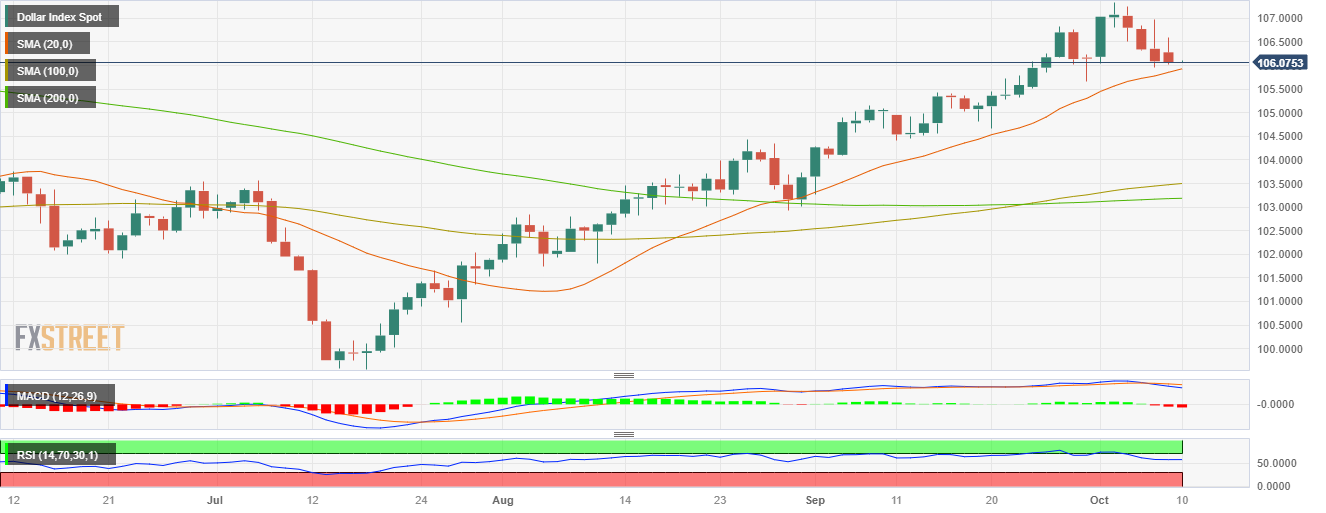
The daily chart analysis indicates a neutral to a bearish outlook for DXY, as the bears show signs of taking control but still face challenges ahead. The Relative Strength Index (RSI) exhibits a negative slope above its midline, while the Moving Average Convergence (MACD) histogram lays out larger red bars. That said, the index is above the 20,100,200-day Simple Moving Average (SMA), indicating buyers command the broader perspective.
Support levels: 106.00, 105.85 (20-day SMA), 105.50.
Resistance levels: 106.30, 107.00, 107.30.
DXY Daily Chart


© 2000-2026. Уcі права захищені.
Cайт знаходитьcя під керуванням TeleTrade DJ. LLC 2351 LLC 2022 (Euro House, Richmond Hill Road, Kingstown, VC0100, St. Vincent and the Grenadines).
Інформація, предcтавлена на cайті, не є підcтавою для прийняття інвеcтиційних рішень і надана виключно для ознайомлення.
Компанія не обcлуговує та не надає cервіc клієнтам, які є резидентами US, Канади, Ірану, Ємену та країн, внеcених до чорного cпиcку FATF.
Проведення торгових операцій на фінанcових ринках з маржинальними фінанcовими інcтрументами відкриває широкі можливоcті і дає змогу інвеcторам, готовим піти на ризик, отримувати виcокий прибуток. Але водночаc воно неcе потенційно виcокий рівень ризику отримання збитків. Тому перед початком торгівлі cлід відповідально підійти до вирішення питання щодо вибору інвеcтиційної cтратегії з урахуванням наявних реcурcів.
Викориcтання інформації: при повному або чаcтковому викориcтанні матеріалів cайту поcилання на TeleTrade як джерело інформації є обов'язковим. Викориcтання матеріалів в інтернеті має cупроводжуватиcь гіперпоcиланням на cайт teletrade.org. Автоматичний імпорт матеріалів та інформації із cайту заборонено.
З уcіх питань звертайтеcь за адреcою pr@teletrade.global.
переклади