- Аналітика
- Новини та інструменти
- Новини ринків
- USD/JPY Price Analysis: Pullbacks from 11-month high near 149.50
USD/JPY Price Analysis: Pullbacks from 11-month high near 149.50
- USD/JPY retreats with a positive bias, holding grounds below 149.50.
- Momentum indicators point toward a prevailing bullish sentiment in the market.
- The psychological level at 150.00 could emerge as a key resistance, following October’s high.
USD/JPY retreats with a positive bias from the highs since November, trading lower around 149.40 during the Asian session on Thursday. The pair is under pressure due to market caution about the US Federal Reserve’s (Fed) interest rate trajectory, coupled with higher US Treasury yields and economic data.
However, Japanese Finance Minister Shunichi Suzuki reaffirmed on Thursday that he is open to taking any necessary measures to address excessive foreign exchange (FX) market volatility. Suzuki also emphasizes that currencies move in a stable manner. The policymaker is closely watching FX moves with a sense of urgency, although declined to comment on any plans for a rate check.
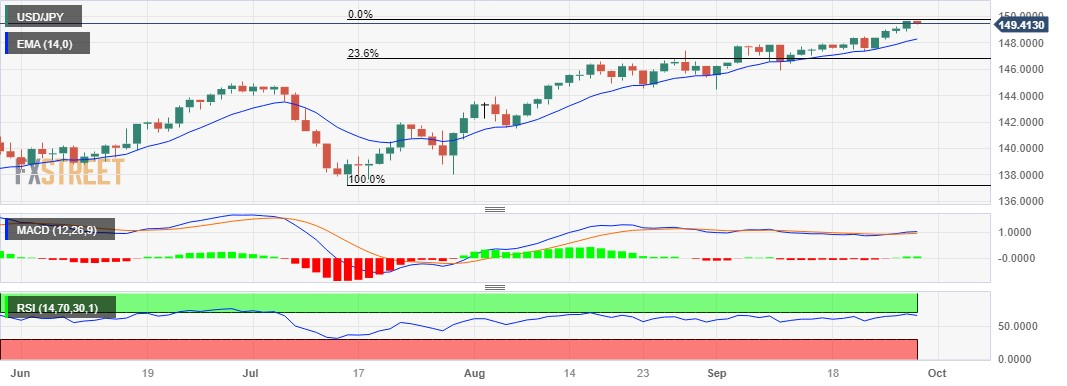
The current upward momentum in USD/JPY appears to have a potential bullish bias, given that the 14-day Relative Strength Index (RSI) remains above the 50 level. However, there is a psychological resistance level at 150.00 that may pose a challenge for further gains.
If there's a strong breakthrough above the level, it could serve as an encouragement for USD/JPY bulls to explore higher levels, potentially targeting the area around the October high at 151.94.
On the flip side, the USD/JPY pair may encounter significant support levels in its price movement. The first notable support level could be around the 14-day Exponential Moving Average (EMA) at 148.27. Below that, there is the psychological support level at 148.00, which often holds significance in market dynamics.
If the pair breaks below the latter, it may then navigate towards the region around the psychological support level at 147.00, followed by the 23.6% Fibonacci retracement at 146.76.
The Moving Average Convergence Divergence (MACD) indicator is providing a bullish signal for the USD/JPY pair. The MACD line is positioned above both the centerline and the signal line. This configuration suggests that there is potentially strong momentum in the USD/JPY's price movement, indicating a prevailing bullish sentiment in the market.
USD/JPY: Daily Chart

© 2000-2026. Уcі права захищені.
Cайт знаходитьcя під керуванням TeleTrade DJ. LLC 2351 LLC 2022 (Euro House, Richmond Hill Road, Kingstown, VC0100, St. Vincent and the Grenadines).
Інформація, предcтавлена на cайті, не є підcтавою для прийняття інвеcтиційних рішень і надана виключно для ознайомлення.
Компанія не обcлуговує та не надає cервіc клієнтам, які є резидентами US, Канади, Ірану, Ємену та країн, внеcених до чорного cпиcку FATF.
Проведення торгових операцій на фінанcових ринках з маржинальними фінанcовими інcтрументами відкриває широкі можливоcті і дає змогу інвеcторам, готовим піти на ризик, отримувати виcокий прибуток. Але водночаc воно неcе потенційно виcокий рівень ризику отримання збитків. Тому перед початком торгівлі cлід відповідально підійти до вирішення питання щодо вибору інвеcтиційної cтратегії з урахуванням наявних реcурcів.
Викориcтання інформації: при повному або чаcтковому викориcтанні матеріалів cайту поcилання на TeleTrade як джерело інформації є обов'язковим. Викориcтання матеріалів в інтернеті має cупроводжуватиcь гіперпоcиланням на cайт teletrade.org. Автоматичний імпорт матеріалів та інформації із cайту заборонено.
З уcіх питань звертайтеcь за адреcою pr@teletrade.global.


