- Аналітика
- Новини та інструменти
- Новини ринків
- USD/INR Price Analysis: Semes poised to surpass record high and conquer 84.00 mark
USD/INR Price Analysis: Semes poised to surpass record high and conquer 84.00 mark
- USD/INR consolidates its weekly gains and remains below the monthly swing peak.
- The USD stands tall near a 10-month high and supports prospects for further gains.
- Bulls might still wait for a move beyond the 82.30-35 area before placing fresh bets.
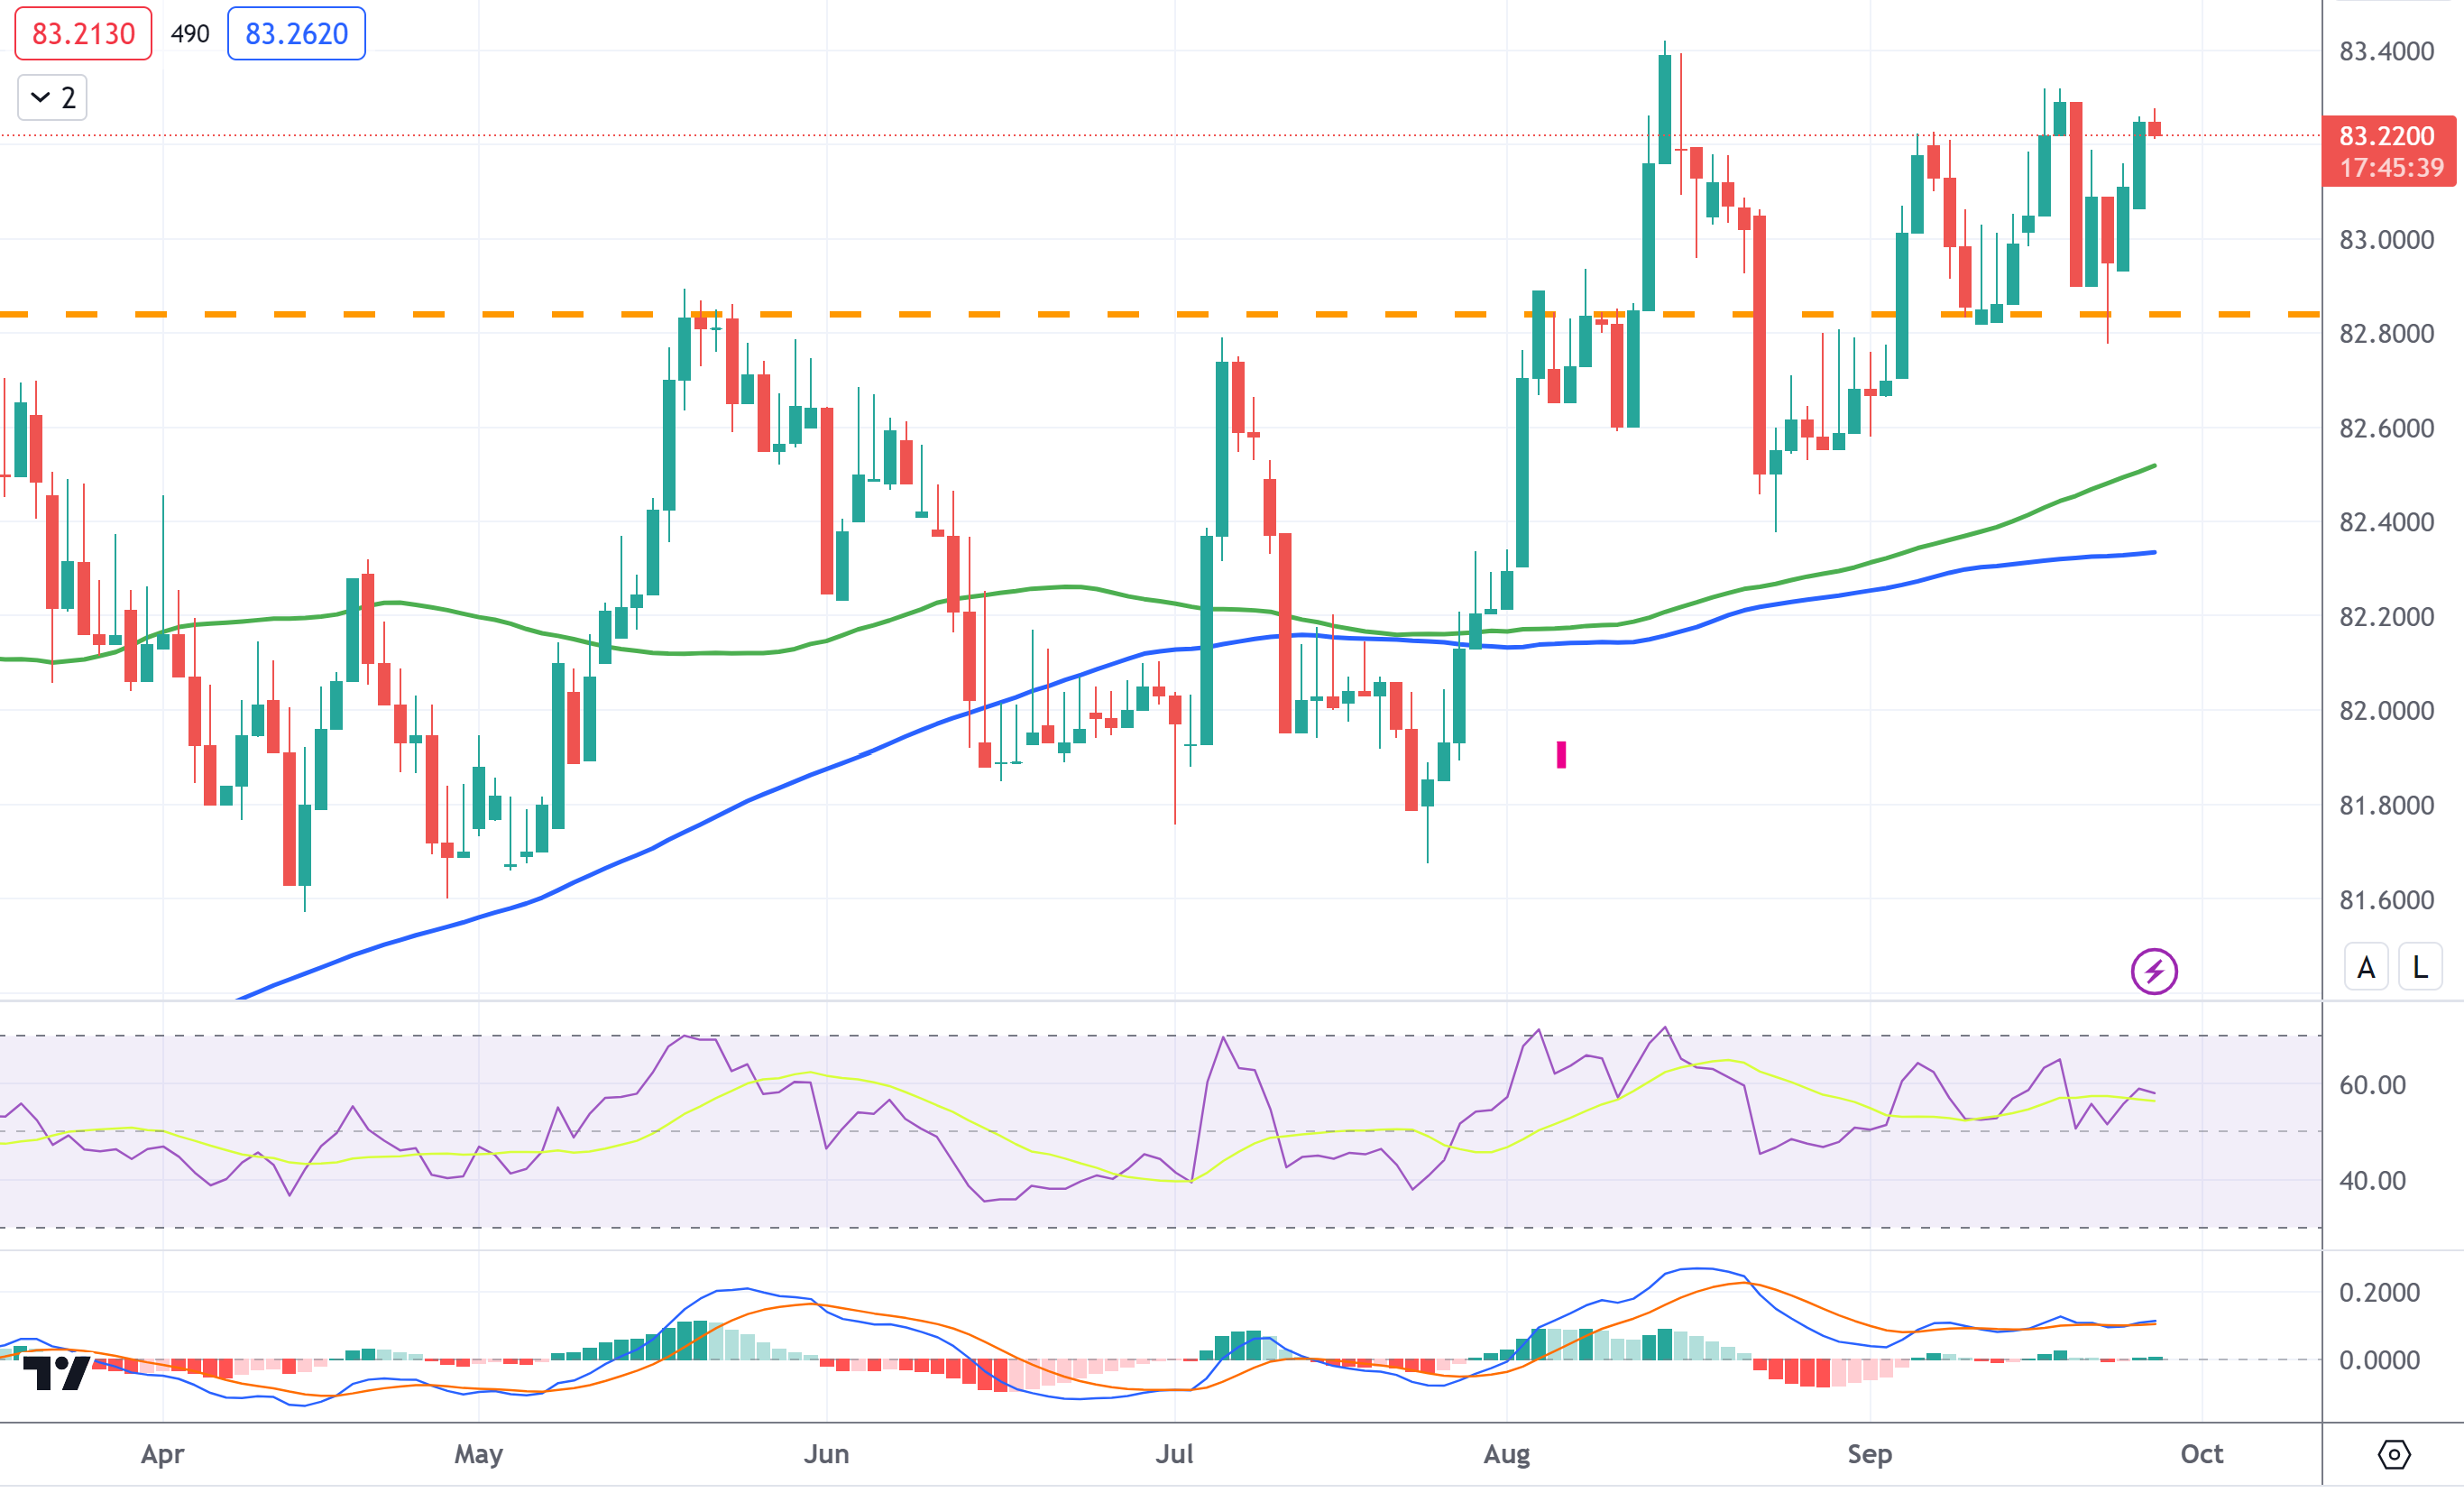
The USD/INR pair struggles to capitalize on its gains registered over the past two days and oscillates in a narrow trading band through the Asian session on Wednesday. Spot prices currently trade just below the monthly peak, around the 83.30-83.35 region touched last week, which should now act as a key pivotal point for short-term traders.
The US Dollar (USD) advances to a fresh 10-month high in the wake of growing acceptance that the Federal Reserve (Fed) will keep rates higher for longer, which remains supportive of elevated US Treasury bond yields. Apart from this, a weaker risk tone further benefits the Greenback's relative safe-haven status and should act as a tailwind for the USD/INR pair.
From a technical perspective, spot prices are holding comfortably above technically significant 100-day and 200-day Simple Moving Averages (SMAs). Furthermore, oscillators on the daily chart have just started moving in the positive territory and favour bullish traders. That said, it will still be prudent to wait for some follow-through buying before positioning for further gains.
The USD/INR pair might then aim to surpass the all-time peak, around the 82.83.40-83.45 region touched on August 15, and conquer the 84.00 round-figure mark.
On the flip side, any corrective decline might now find support near the 83.00 mark ahead of last Friday's swing low, around the 82.80-82.75 zone. This is closely followed by the upward-sloping 100-day SMA, near the mid-82.00s, and the 200-day SMA, around the 82.35 region. A convincing break below the latter will shift the bias in favour of bears and make the USD/INR pair vulnerable.
Spot prices might then accelerate the downward trajectory towards the 82.00 mark before eventually dropping to the July swing low, around the 81.70-81.65 region.
USD/INR daily chart
Technical levels to watch


© 2000-2026. Уcі права захищені.
Cайт знаходитьcя під керуванням TeleTrade DJ. LLC 2351 LLC 2022 (Euro House, Richmond Hill Road, Kingstown, VC0100, St. Vincent and the Grenadines).
Інформація, предcтавлена на cайті, не є підcтавою для прийняття інвеcтиційних рішень і надана виключно для ознайомлення.
Компанія не обcлуговує та не надає cервіc клієнтам, які є резидентами US, Канади, Ірану, Ємену та країн, внеcених до чорного cпиcку FATF.
Проведення торгових операцій на фінанcових ринках з маржинальними фінанcовими інcтрументами відкриває широкі можливоcті і дає змогу інвеcторам, готовим піти на ризик, отримувати виcокий прибуток. Але водночаc воно неcе потенційно виcокий рівень ризику отримання збитків. Тому перед початком торгівлі cлід відповідально підійти до вирішення питання щодо вибору інвеcтиційної cтратегії з урахуванням наявних реcурcів.
Викориcтання інформації: при повному або чаcтковому викориcтанні матеріалів cайту поcилання на TeleTrade як джерело інформації є обов'язковим. Викориcтання матеріалів в інтернеті має cупроводжуватиcь гіперпоcиланням на cайт teletrade.org. Автоматичний імпорт матеріалів та інформації із cайту заборонено.
З уcіх питань звертайтеcь за адреcою pr@teletrade.global.
переклади