- Аналітика
- Новини та інструменти
- Новини ринків
- USD/INR Price Analysis: Climbs to 83.20-25 area, back closer to monthly swing high
USD/INR Price Analysis: Climbs to 83.20-25 area, back closer to monthly swing high
- USD/INR scales higher for the second straight day and touches a multi-day top on Tuesday.
- The technical setup warrants some caution for bulls and before positioning for further gains.
- Any corrective decline towards the 83.00 mark could now be seen as a buying opportunity.
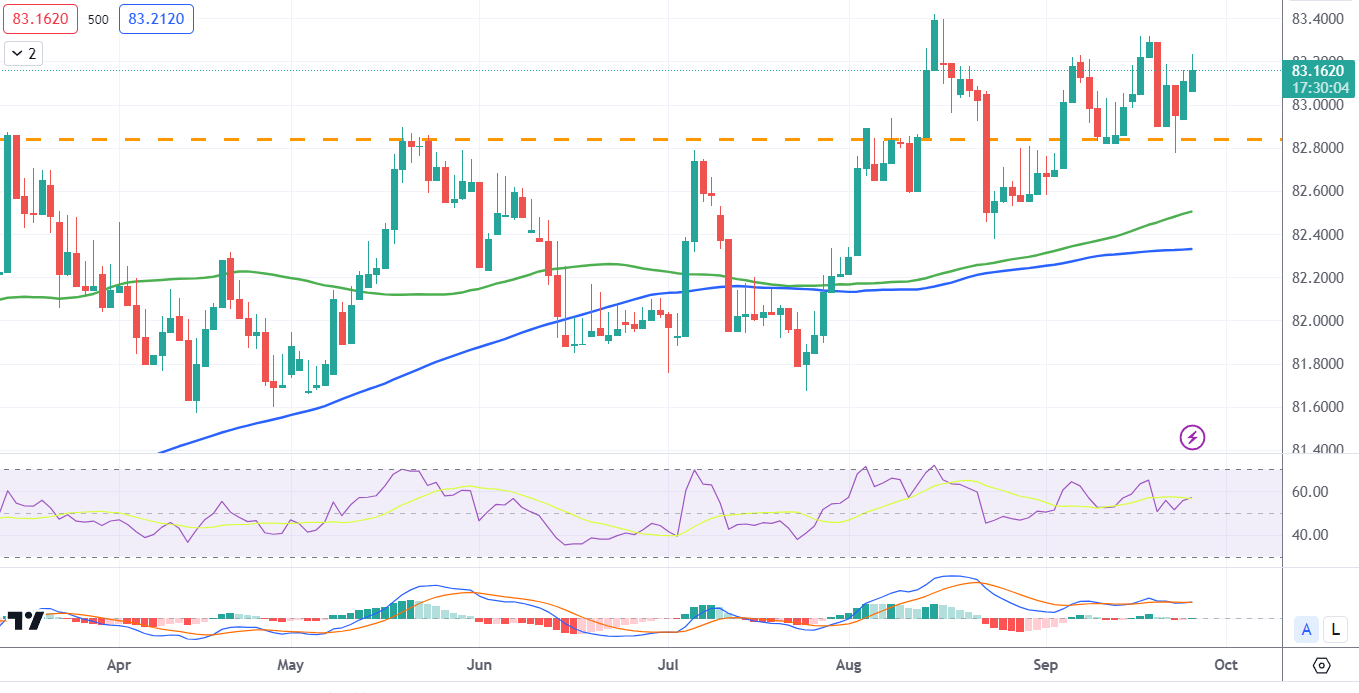
The USD/INR pair gains some positive traction for the second successive day on Tuesday and climbs to a multi-day peak during the Asian session. Spot prices currently trade around the 83.20 area, up 0.15% for the day, and remain well within the striking distance of the monthly peak touched last week.
The prospects for further policy tightening by the Federal Reserve (Fed) continue to push the US Treasury bond yields higher and underpin the US Dollar (USD). Apart from this, the risk-off impulse – as depicted by a weaker tone around the equity markets – assists the safe-haven Greenback to stand tall near its highest level since December 2022 touched on Monday. This, in turn, is seen as a key factor that continues to act as a tailwind for the USD/INR pair.
From a technical perspective, oscillators on the daily chart are yet to gain any meaningful positive traction and warrant caution for aggressive bullish traders. Hence, it will be prudent to wait for some follow-through buying beyond the 82.30 area, or the monthly top, before positioning for further appreciating move. The USD/INR pair might then surpass the all-time peak, around the 83.40-83.45 region touched on August 15, and aim to conquer the 84.00 round figure.
On the flip side, any corrective decline might now find some support near the 83.00 mark ahead of Friday's swing low, around the 82.80-82.75 region. This is closely followed by the upward-sloping 100-day Simple Moving Average (SMA), currently pegged near the mid-82.00s, and the 200-day SMA, around the 82.35 region. The latter should act as a key pivotal point for the USD/INR pair, which if broken decisively will be seen as a fresh trigger for bearish traders.
Spot prices might then turn vulnerable to accelerate the downfall towards the 82.00 mark. The downward trajectory could get extended further and eventually drag the USD/INR pair to the July swing low, around the 81.70-81.65 region.
USD/INR daily chart
Techincal levels to watch


© 2000-2026. Уcі права захищені.
Cайт знаходитьcя під керуванням TeleTrade DJ. LLC 2351 LLC 2022 (Euro House, Richmond Hill Road, Kingstown, VC0100, St. Vincent and the Grenadines).
Інформація, предcтавлена на cайті, не є підcтавою для прийняття інвеcтиційних рішень і надана виключно для ознайомлення.
Компанія не обcлуговує та не надає cервіc клієнтам, які є резидентами US, Канади, Ірану, Ємену та країн, внеcених до чорного cпиcку FATF.
Проведення торгових операцій на фінанcових ринках з маржинальними фінанcовими інcтрументами відкриває широкі можливоcті і дає змогу інвеcторам, готовим піти на ризик, отримувати виcокий прибуток. Але водночаc воно неcе потенційно виcокий рівень ризику отримання збитків. Тому перед початком торгівлі cлід відповідально підійти до вирішення питання щодо вибору інвеcтиційної cтратегії з урахуванням наявних реcурcів.
Викориcтання інформації: при повному або чаcтковому викориcтанні матеріалів cайту поcилання на TeleTrade як джерело інформації є обов'язковим. Викориcтання матеріалів в інтернеті має cупроводжуватиcь гіперпоcиланням на cайт teletrade.org. Автоматичний імпорт матеріалів та інформації із cайту заборонено.
З уcіх питань звертайтеcь за адреcою pr@teletrade.global.
переклади