- Аналітика
- Новини та інструменти
- Новини ринків
- AUD/USD struggles as the US Dollar soars to a nine-month high, eyes on RBA conference
AUD/USD struggles as the US Dollar soars to a nine-month high, eyes on RBA conference
- AUD/USD trades at 0.6423, experiencing a 0.25% drop on Monday, as the US Dollar Index (DXY) reaches a ten-month high at 106.09, driven by elevated US bond yields.
- US Treasury bond yields touch multi-year highs, with the 10-year T-bond rate hitting 4.533%, reflecting the US Federal Reserve’s 'higher for longer' stance on interest rates.
- Federal Reserve officials, advocate for a cautious and patient approach to monetary policy, not ruling out the possibility of another rate hike, while Australian traders await key economic releases.
The Australian Dollar (AUD) lost some ground against the US Dollar (USD) as the latter strengthened the most in nine months, underpinned by elevated US bond yields. Hence, the AUD/USD is trading at 0.6423, printing minuscule gains as the Asian session begins, but on Monday, it dropped 0.25%.
AUD/USD faces pressure as the buck’s climbs to multi-month rise
Wall Street finished Monday’s session with gains led by the Nasdaq and followed by the S&P 500. The Greenback remains in the driver’s seat as investors brace for the US Federal Reserve’s mantra “higher for longer,” as US Treasury bond yields touch multi-year highs. The US 10-year T-bond rate hit 4.533% during the session, while the US Dollar Index (DXY) rose to a ten-month high at 106.09.
Data-wise, the Chicago Fed National Activity Index plunged to -0.16 in August from 0.07 in July, while the Dallas Fed Manufacturing Index plummeted to -18.1 in September from -17.2 the prior month.
Federal Reserve speakers in the central bank adopted a cautious stance, mainly Boston and San Francisco Fed Presidents Susan Collins and Mary Daly. Both stressed the Fed should be patient on monetary policy but haven’t ruled out another rate hike. Recently, the Chicago Fed President Austan Goolsbee said that a soft landing is possible, but inflation risks remain tilted to the upside.
Meanwhile, AUD/USD traders would take cues from the Australian economic docket with the release of the Reserve Bank of Australia (RBA) Conference in inflation. On the US front, the docket would release the S&P/Case-Shiller Home Prices, alongside housing data and the CB Consumer Confidence.
AUD/USD Price Analysis: Technical outlook
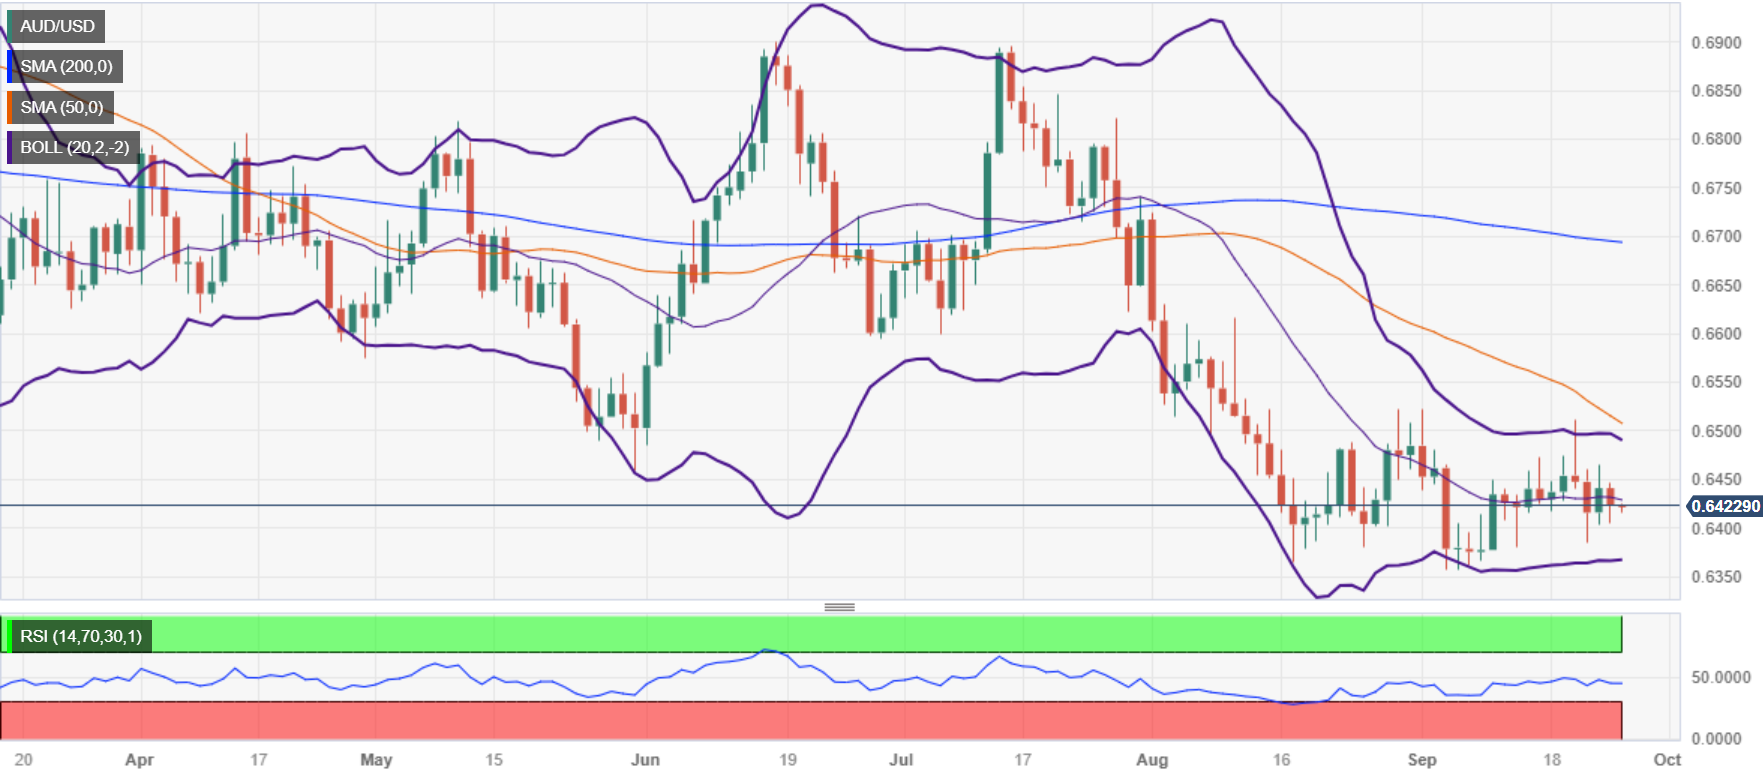
The Aussie’s daily chart portrays the currency pair as neutral to downward biased. Currently is consolidated at around the 0.6400 mark, but a bearish-harami candlestick chart pattern could pave the way for further losses. The first support is seen at the current exchange rate, at around two and a half years of support trendline. A breach of the latter would open the door to test the September 4 low of 0.6357, followed by the November 22 swing low of 0.6272. Conversely, if the pair climbs past the 0.6500 figure, the next resistance is at the 50-day moving average (DMA) at 0.6671.


© 2000-2026. Уcі права захищені.
Cайт знаходитьcя під керуванням TeleTrade DJ. LLC 2351 LLC 2022 (Euro House, Richmond Hill Road, Kingstown, VC0100, St. Vincent and the Grenadines).
Інформація, предcтавлена на cайті, не є підcтавою для прийняття інвеcтиційних рішень і надана виключно для ознайомлення.
Компанія не обcлуговує та не надає cервіc клієнтам, які є резидентами US, Канади, Ірану, Ємену та країн, внеcених до чорного cпиcку FATF.
Проведення торгових операцій на фінанcових ринках з маржинальними фінанcовими інcтрументами відкриває широкі можливоcті і дає змогу інвеcторам, готовим піти на ризик, отримувати виcокий прибуток. Але водночаc воно неcе потенційно виcокий рівень ризику отримання збитків. Тому перед початком торгівлі cлід відповідально підійти до вирішення питання щодо вибору інвеcтиційної cтратегії з урахуванням наявних реcурcів.
Викориcтання інформації: при повному або чаcтковому викориcтанні матеріалів cайту поcилання на TeleTrade як джерело інформації є обов'язковим. Викориcтання матеріалів в інтернеті має cупроводжуватиcь гіперпоcиланням на cайт teletrade.org. Автоматичний імпорт матеріалів та інформації із cайту заборонено.
З уcіх питань звертайтеcь за адреcою pr@teletrade.global.
переклади