- Аналітика
- Новини та інструменти
- Новини ринків
- USD/INR Price Analysis: Sticks to modest intraday gains above 83.00 amid stronger USD
USD/INR Price Analysis: Sticks to modest intraday gains above 83.00 amid stronger USD
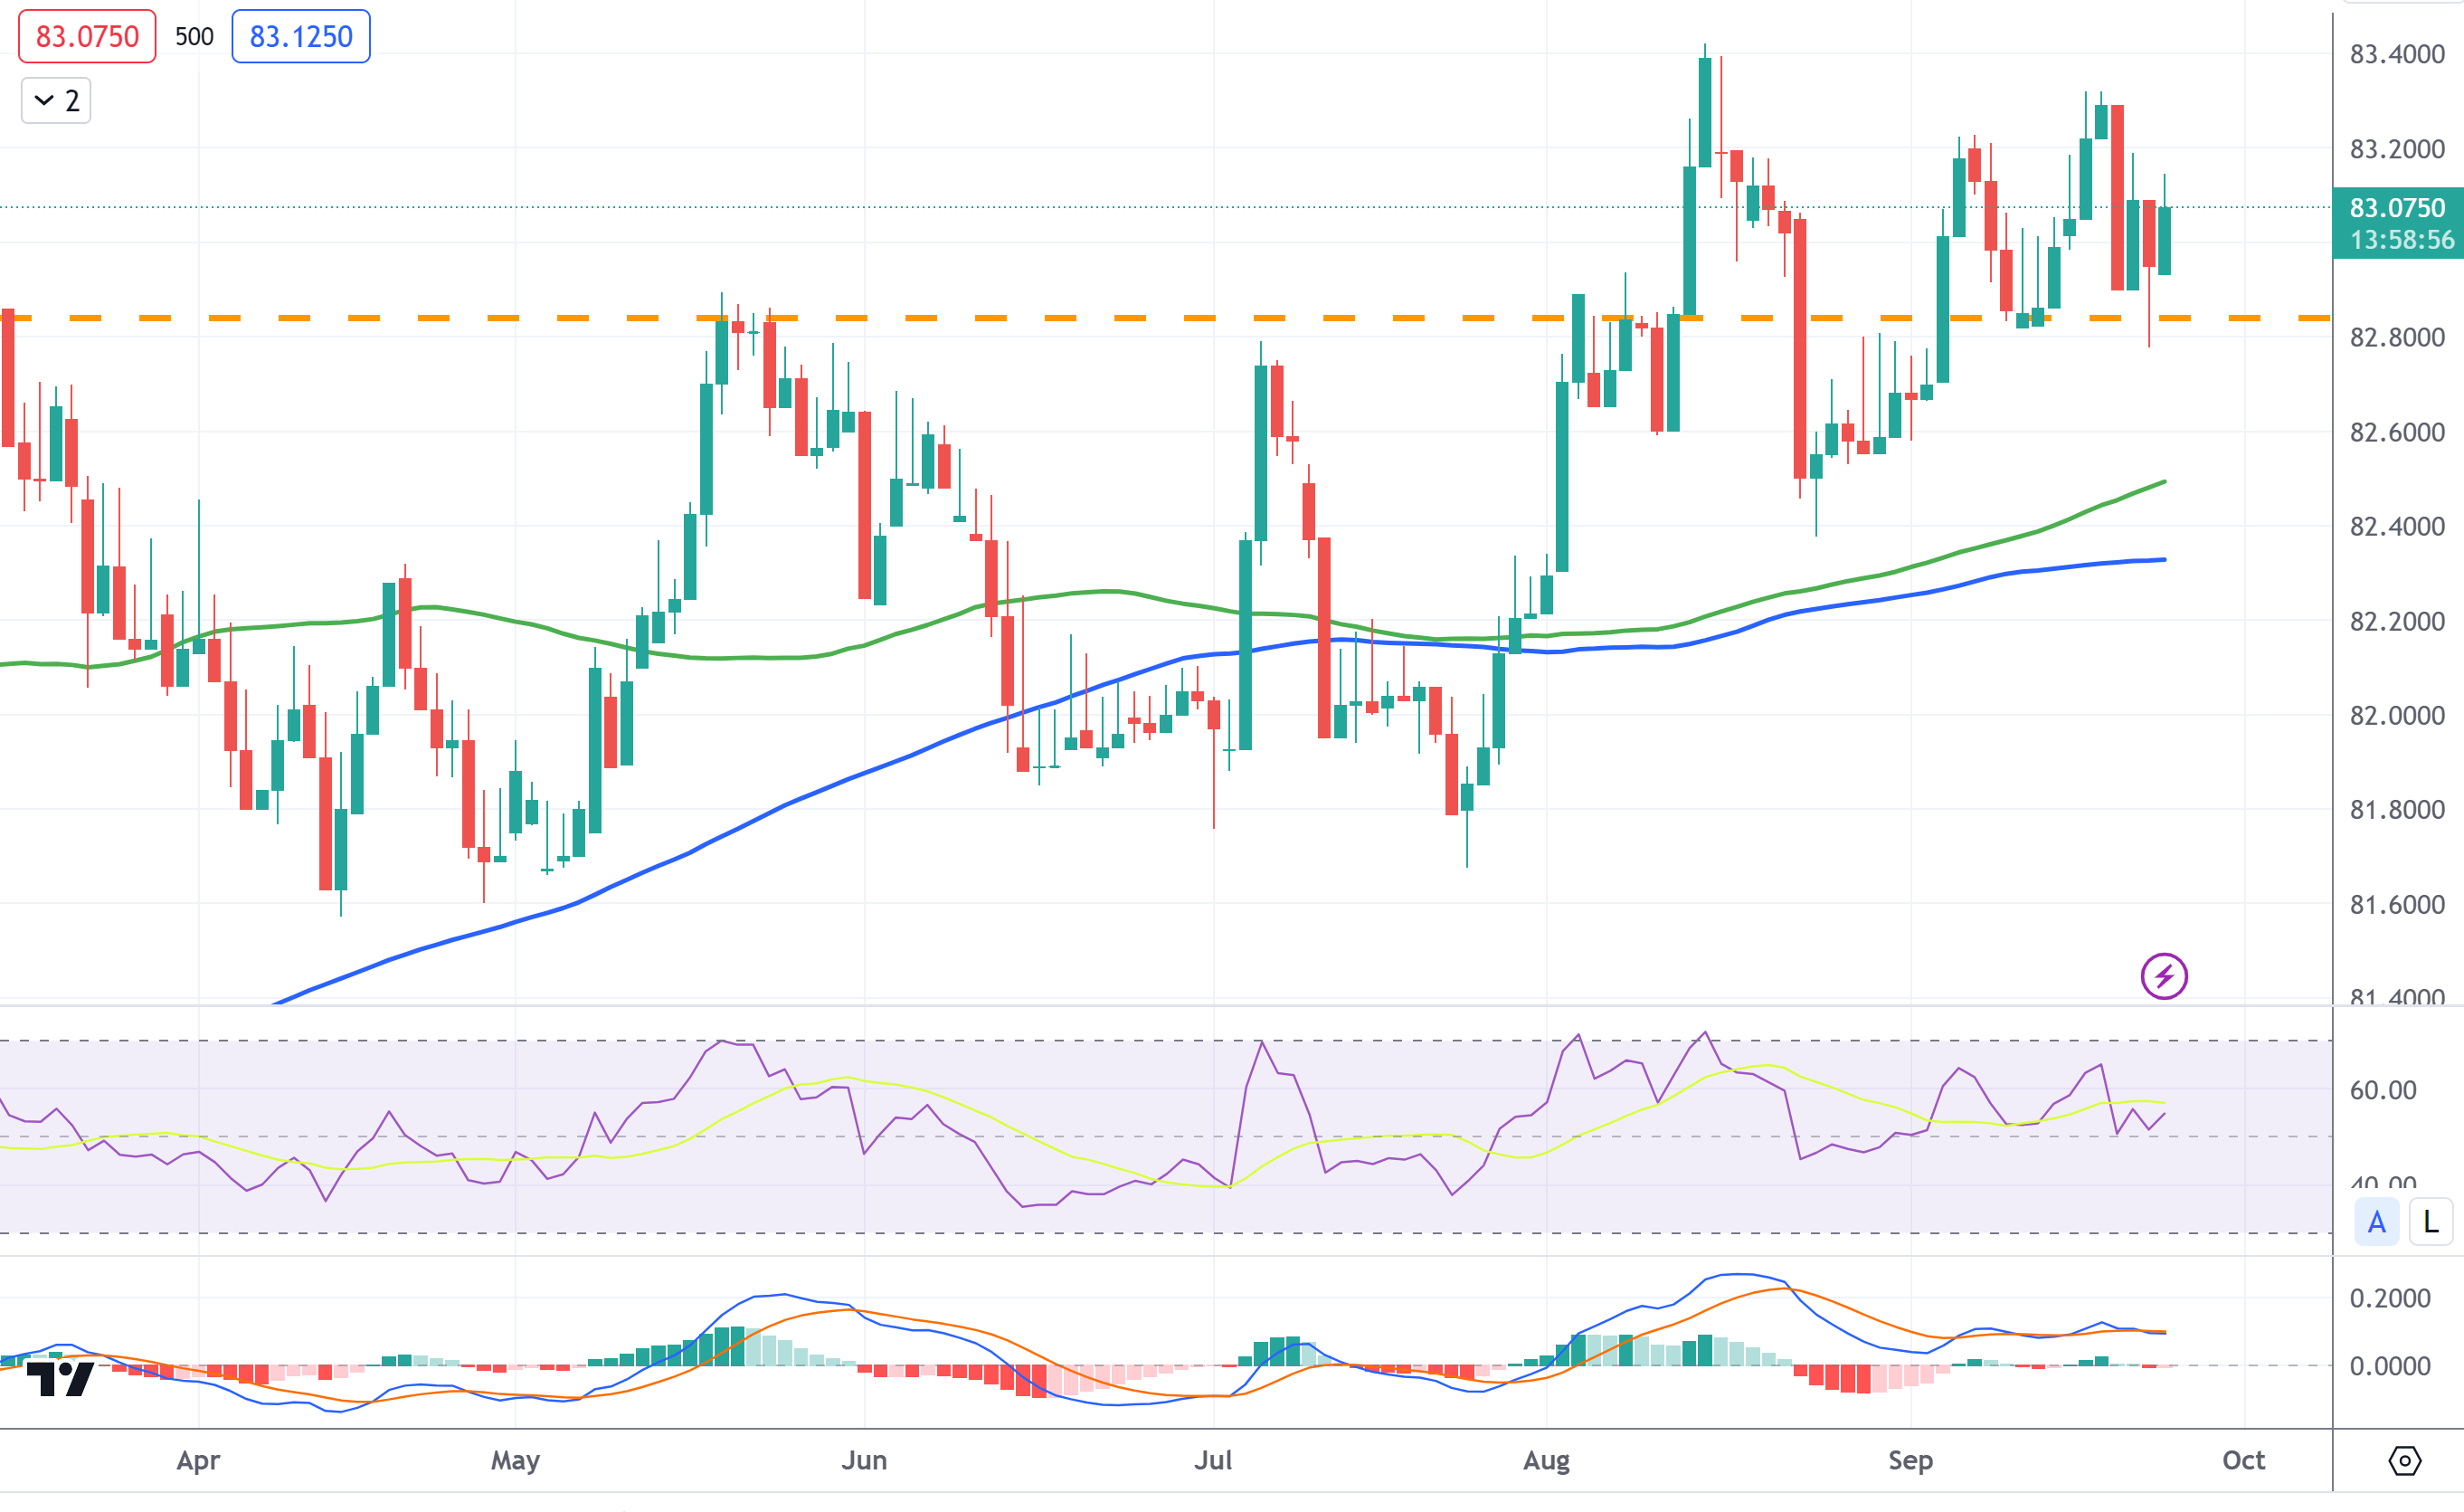
- USD/INR catches fresh bids on Monday and draws support from a bullish USD.
- Neutral oscillators on the daily chart warrant some caution for bullish traders.
- Any meaningful slide might continue to attract fresh buyers and remain limited.
The USD/INR pair regains positive traction on the first day of a new week and moves away from a nearly three-week low, around the 82.80-82.75 region touched on Friday. Spot prices stick to intraday gains through the early part of the European session and currently trade above the 83.00 round-figure mark.
The prospects for further policy tightening by the Federal Reserve (Fed) remain supportive of elevated US Treasury bond yields and assist the US Dollar (USD) to hold steady near its highest level in more than six months. Apart from this, persistent worries about a property market crisis in China further benefit the Greenback's relative safe-haven status and act as a tailwind for the USD/INR pair.
From a technical perspective, neutral oscillators on the daily chart warrant some caution before positioning for further intraday appreciating move. Hence, any subsequent strength is likely to confront resistance near the 82.30 zone ahead of the all-time peak, around the 83.40-83.45 region touched on August 15, which if cleared decisively should allow the USD/INR pair to conquer the 84.00 round figure.
On the flip side, the 82.80-82.75 region, or Friday's swing low should protect the immediate downside. This is closely followed by the upward-sloping 100-day Simple Moving Average (SMA), currently pegged near the mid-82.00s, and the 200-day SMA, around the 82.35 region. The latter should act as a key pivotal point for the USD/INR pair and a convincing break below will be seen as a fresh trigger for bears.
Spot prices might then turn vulnerable to accelerate the slide towards the 82.00 mark. The downward trajectory could get extended further and eventually drag the USD/INR pair to the July swing low, around the 81.70-81.65 region.
USD/INR daily chart
Technical levels to watch


© 2000-2026. Уcі права захищені.
Cайт знаходитьcя під керуванням TeleTrade DJ. LLC 2351 LLC 2022 (Euro House, Richmond Hill Road, Kingstown, VC0100, St. Vincent and the Grenadines).
Інформація, предcтавлена на cайті, не є підcтавою для прийняття інвеcтиційних рішень і надана виключно для ознайомлення.
Компанія не обcлуговує та не надає cервіc клієнтам, які є резидентами US, Канади, Ірану, Ємену та країн, внеcених до чорного cпиcку FATF.
Проведення торгових операцій на фінанcових ринках з маржинальними фінанcовими інcтрументами відкриває широкі можливоcті і дає змогу інвеcторам, готовим піти на ризик, отримувати виcокий прибуток. Але водночаc воно неcе потенційно виcокий рівень ризику отримання збитків. Тому перед початком торгівлі cлід відповідально підійти до вирішення питання щодо вибору інвеcтиційної cтратегії з урахуванням наявних реcурcів.
Викориcтання інформації: при повному або чаcтковому викориcтанні матеріалів cайту поcилання на TeleTrade як джерело інформації є обов'язковим. Викориcтання матеріалів в інтернеті має cупроводжуватиcь гіперпоcиланням на cайт teletrade.org. Автоматичний імпорт матеріалів та інформації із cайту заборонено.
З уcіх питань звертайтеcь за адреcою pr@teletrade.global.
переклади