- Аналітика
- Новини та інструменти
- Новини ринків
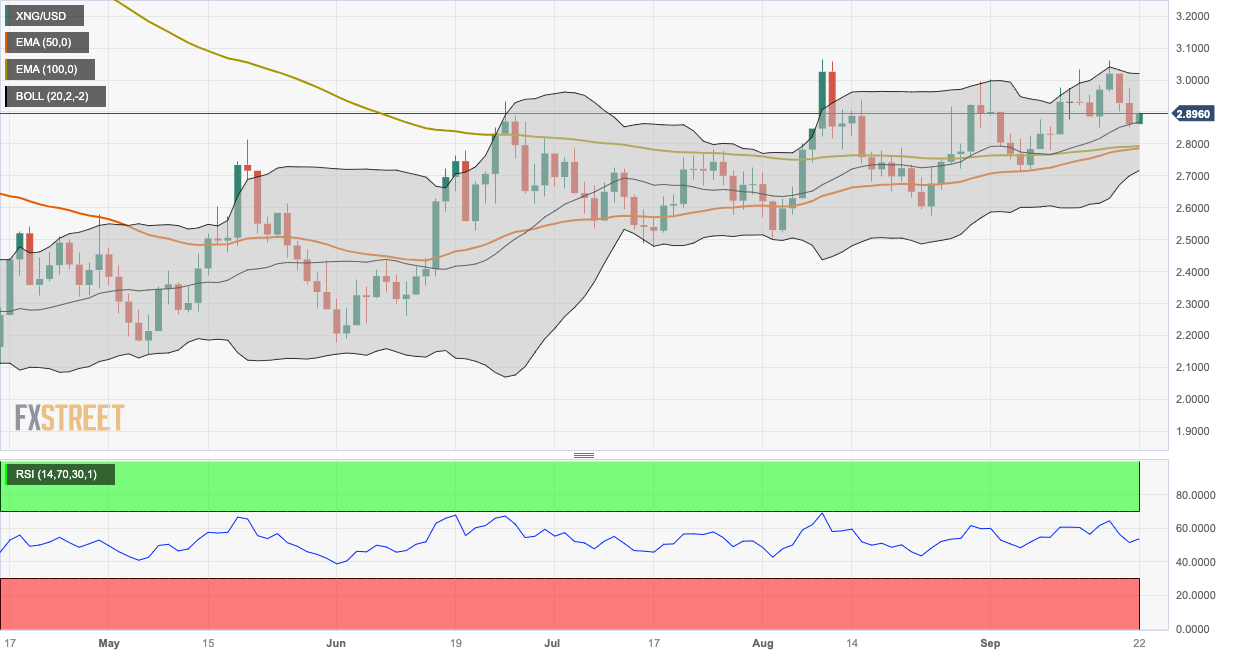
- Natural Gas Price Analysis: XNG/USD snaps two-day losing streak below $3.00, Bull cross eyed
Natural Gas Price Analysis: XNG/USD snaps two-day losing streak below $3.00, Bull cross eyed
- Natural Gas price attracts some buyers and turns positive around $2.89 on Friday.
- The 50-hour EMA is on the verge of crossing above the 100-hour EMA.
- Relative Strength Index (RSI) stands in bullish territory above 50.
- The key resistance level for XNG/USD is located at $3.00; the critical support level is located at $2.78.
Natural Gas price (XNG/USD) recovers its losses during the early European trading hours on Friday. XNG/USD currently trades near $2.89 per MMBtu, gaining 1.19% for the day. The Energy Information Administration (EIA) revealed on Thursday that the weekly Natural Gas Storage Change for the week ending September 15 increased by 64B from the previous week of 67B.
From a technical perspective, Natural Gas price holds above the 50- and 100-day Exponential Moving Averages (EMAs) on the daily chart. It’s worth noting that the 50-hour EMA is on the verge of crossing above the 100-hour EMA. If a decisive crossover occurs on the daily chart, it would validate a Bull Cross, highlighting the path of least resistance for XNG/USD is to the upside. Meanwhile, the Relative Strength Index (RSI) stands in bullish territory above 50, supporting the buyers for now.
The key resistance level for natural gas is located at $3.00, representing the confluence of the upper boundary of the Bollinger Band, a psychological round mark, and a high of September 20. A break above the latter will see the next barrier at $3.08 (a high of March 3). Further north, the additional upside filter is seen around a high of January 24 at $3.30
On the flip side, the critical support level is located at $2.78. The mentioned level portrays the convergence of 50- and 100-day EMAs. The next contention level will emerge at $2.70 (the lower limit of the Bollinger Band). Any follow-through selling below the latter will see a drop to $2.50 (a low of August 2), and finally at $2.26 (a low of June 12).
XNG/USD daily chart


© 2000-2026. Уcі права захищені.
Cайт знаходитьcя під керуванням TeleTrade DJ. LLC 2351 LLC 2022 (Euro House, Richmond Hill Road, Kingstown, VC0100, St. Vincent and the Grenadines).
Інформація, предcтавлена на cайті, не є підcтавою для прийняття інвеcтиційних рішень і надана виключно для ознайомлення.
Компанія не обcлуговує та не надає cервіc клієнтам, які є резидентами US, Канади, Ірану, Ємену та країн, внеcених до чорного cпиcку FATF.
Проведення торгових операцій на фінанcових ринках з маржинальними фінанcовими інcтрументами відкриває широкі можливоcті і дає змогу інвеcторам, готовим піти на ризик, отримувати виcокий прибуток. Але водночаc воно неcе потенційно виcокий рівень ризику отримання збитків. Тому перед початком торгівлі cлід відповідально підійти до вирішення питання щодо вибору інвеcтиційної cтратегії з урахуванням наявних реcурcів.
Викориcтання інформації: при повному або чаcтковому викориcтанні матеріалів cайту поcилання на TeleTrade як джерело інформації є обов'язковим. Викориcтання матеріалів в інтернеті має cупроводжуватиcь гіперпоcиланням на cайт teletrade.org. Автоматичний імпорт матеріалів та інформації із cайту заборонено.
З уcіх питань звертайтеcь за адреcою pr@teletrade.global.
переклади