- Аналітика
- Новини та інструменти
- Новини ринків
- S&P 500 ends modest Monday trading as markets reflect ahead of Fed
S&P 500 ends modest Monday trading as markets reflect ahead of Fed
- US equities take a minute to digest, spreading into the middle for Monday.
- S&P 500, DJIA, and NASDAQ all post slim gains for Monday as markets go quiet.
- Fed rate call promises plenty of action for the mid-week.
The Standard & Poor’s (S&P) 500 US equity index wrapped up Monday markets barely changed on the day, near $4,453.00 as US equities take a breather before the Federal Reserve (Fed) drops their latest rate call on Wednesday.
Fed to bring rate call, economic projections in the mid-week
The S&P saw thin trading for Monday as investors gear up for the latest showing from the Fed and its Federal Open Market Committee, which is expected to hold rates steady at the next meeting slated for Wednesday.
The US central bank is set to stand pat on interest rates, and investors will be paying close attention to the FOMC press conference to follow the rate call, looking for any hints about the path forward on the rate hike cycle.
The FOMC will also be releasing their updated inflation expectations for the US economy alongside the Fed’s latest monetary policy statement.
American equities spread their bets on Monday, with the S&P 500, Dow Jones Industrial Average (DJIA), and NASDAQ Composite indexes all wrapping up the day near where they started. The S&P finished the big winner, gaining a scant 0.07% during market hours.
The DJIA and the NASDAQ competed in a slow race, with the indexes closing +0.02% and 0.01% respectively. The DJIA heads into the overnight session trading into $34,625.00 while the NASDAQ sits just above $13,710.00.
S&P 500 technical outlook
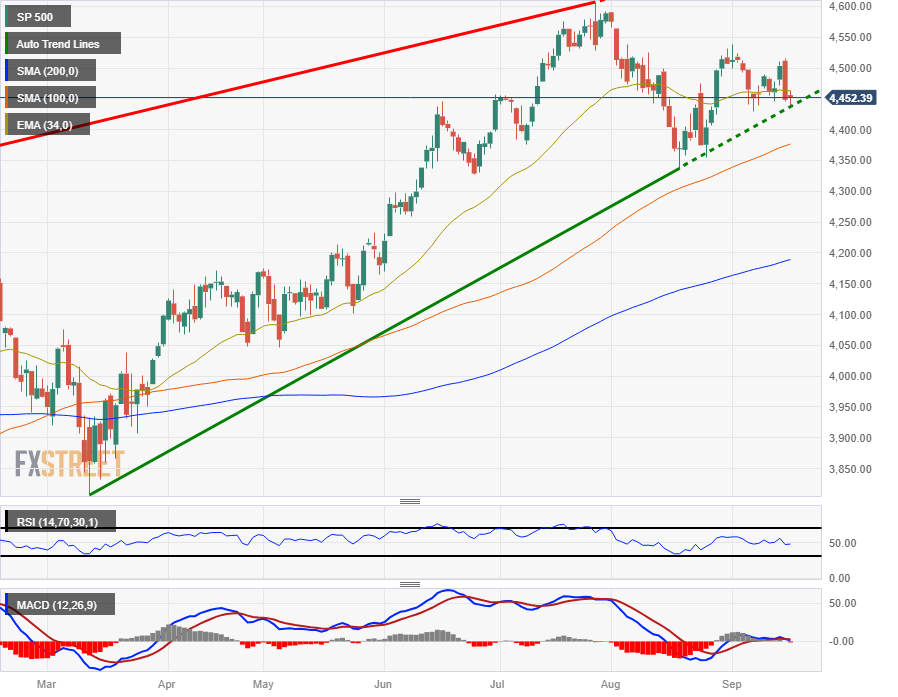
The S&P 500 is tipping into support from the rising trendline baked in from March’s lows near $3,800.00, and continued downside will see support from the 100-day Simple Moving Average (SMA) at $4,376.00.
The 200-day SMA sits well below price action near $4,190.00, and market prices are being constrained by a sideways 34-day Exponential Moving Average (EMA), and a lack of meaningful directional momentum is seeing technical indicators drift into their midpoints.
Current chart patterns see a floor from the last swing low eat $4,350.00 and the ceiling marked in from September’s high point near $4,540.00.
S&P 500 daily chart
S&P 500 technical levels


© 2000-2026. Уcі права захищені.
Cайт знаходитьcя під керуванням TeleTrade DJ. LLC 2351 LLC 2022 (Euro House, Richmond Hill Road, Kingstown, VC0100, St. Vincent and the Grenadines).
Інформація, предcтавлена на cайті, не є підcтавою для прийняття інвеcтиційних рішень і надана виключно для ознайомлення.
Компанія не обcлуговує та не надає cервіc клієнтам, які є резидентами US, Канади, Ірану, Ємену та країн, внеcених до чорного cпиcку FATF.
Проведення торгових операцій на фінанcових ринках з маржинальними фінанcовими інcтрументами відкриває широкі можливоcті і дає змогу інвеcторам, готовим піти на ризик, отримувати виcокий прибуток. Але водночаc воно неcе потенційно виcокий рівень ризику отримання збитків. Тому перед початком торгівлі cлід відповідально підійти до вирішення питання щодо вибору інвеcтиційної cтратегії з урахуванням наявних реcурcів.
Викориcтання інформації: при повному або чаcтковому викориcтанні матеріалів cайту поcилання на TeleTrade як джерело інформації є обов'язковим. Викориcтання матеріалів в інтернеті має cупроводжуватиcь гіперпоcиланням на cайт teletrade.org. Автоматичний імпорт матеріалів та інформації із cайту заборонено.
З уcіх питань звертайтеcь за адреcою pr@teletrade.global.
переклади