- Аналітика
- Новини та інструменти
- Новини ринків
- USD/CAD dips into 1.3480 as oil continues to bolster crude-dependent Loonie
USD/CAD dips into 1.3480 as oil continues to bolster crude-dependent Loonie
- Oil prices are surging thanks to ongoing supply constraint concerns, sending the CAD soaring against the USD.
- The Federal Reserve's latest rate call is expected to hold steady in the midweek.
- Economic Calendar sees several high-impact figures for both the USD and CAD this week.
The USD/CAD continues to tip to the downside as the Loonie (CAD) gets pushed higher by rising oil prices.
Oil prices continue to chew through chart paper, with West Texas Intermediary (WTI) US crude oil marking a fresh high of $91/bbl in Monday trading.
The USD/CAD is testing into five-week lows as the US Dollar (USD) gives up ground against the commodity-supported CAD, but the midweek sees the Federal Reserve (Fed) landing with another rate call. Markets are broadly expecting the Federal Open Market Committee (FOMC) to hold steady with interest rates at 5%.
Fed's rate call in the pipe for the mid-week, US data to dominate market reactions
Oil prices will be driving the USD/CAD for the early week, but the economic calendar will see plenty of Greenback-based momentum from Wednesday onwards. However, before any of that can happen, the CAD will see Consumer Price Index (CPI) figures for Canada on Tuesday.
The Canadian CPI is scheduled for 12:30 GMT Tuesday, and is expected to climb to 3.8% from the previous 3.3% as the Bank of Canada (BoC) struggles to contain inflation largely bolstered by rising energy prices.
Thursday will bring US Initial Jobless Claims which lasted printed at 220K, while Friday sees Canadian Retail Sales for July, forecast to tick higher from 0.1% to 0.4%.
US Manufacturing and Services Purchasing Manager Index (PMI) data is also slated for Friday. The Manufacturing PMI is expected to decline slightly from 47.9 to 47.8, while the services component is seen declining from 50.5 to 50.3.
USD/CAD technical outlook
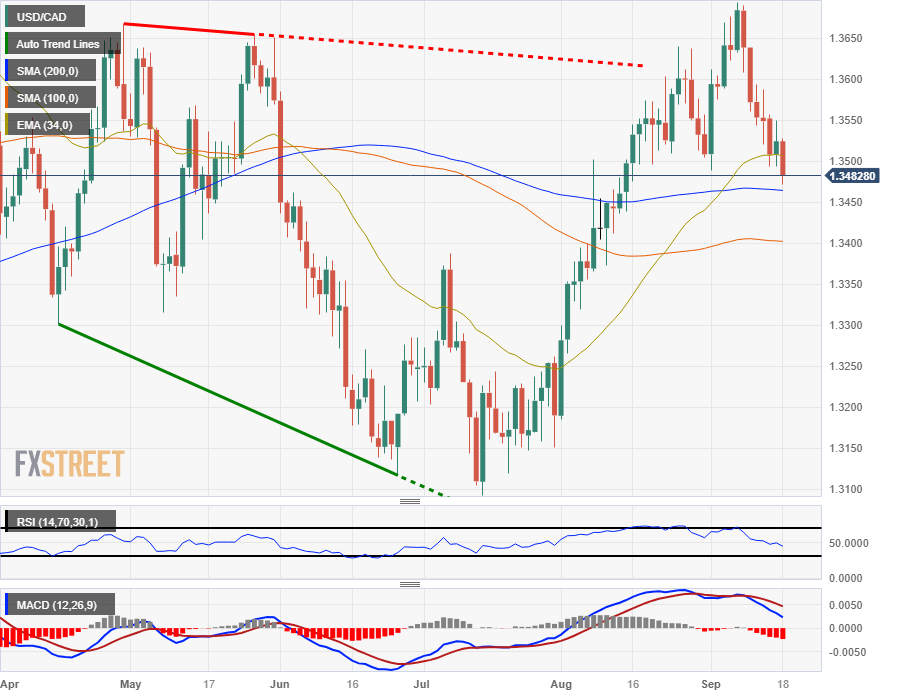
The Dollar-Loonie pairing is trading to the midpoint of familiar territory initially reached in late 2022, and the pair is rapidly approaching the 200-day Simple Moving Average (SMA) near 1.3464 as prices slip past the 34-day Exponential Moving Average (EMA), currently turning bearish into 1.3505.
The Relative Strength Index (RSI) and Moving Average Convergence-Divergence (MACD) indicators are firmly bearish on daily candlesticks, and the indicators are warning buyers that there could still be plenty of room to run towards the downside before a successful bullish offensive can be mounted.
USD/CAD daily chart
USD/CAD technical levels


© 2000-2026. Уcі права захищені.
Cайт знаходитьcя під керуванням TeleTrade DJ. LLC 2351 LLC 2022 (Euro House, Richmond Hill Road, Kingstown, VC0100, St. Vincent and the Grenadines).
Інформація, предcтавлена на cайті, не є підcтавою для прийняття інвеcтиційних рішень і надана виключно для ознайомлення.
Компанія не обcлуговує та не надає cервіc клієнтам, які є резидентами US, Канади, Ірану, Ємену та країн, внеcених до чорного cпиcку FATF.
Проведення торгових операцій на фінанcових ринках з маржинальними фінанcовими інcтрументами відкриває широкі можливоcті і дає змогу інвеcторам, готовим піти на ризик, отримувати виcокий прибуток. Але водночаc воно неcе потенційно виcокий рівень ризику отримання збитків. Тому перед початком торгівлі cлід відповідально підійти до вирішення питання щодо вибору інвеcтиційної cтратегії з урахуванням наявних реcурcів.
Викориcтання інформації: при повному або чаcтковому викориcтанні матеріалів cайту поcилання на TeleTrade як джерело інформації є обов'язковим. Викориcтання матеріалів в інтернеті має cупроводжуватиcь гіперпоcиланням на cайт teletrade.org. Автоматичний імпорт матеріалів та інформації із cайту заборонено.
З уcіх питань звертайтеcь за адреcою pr@teletrade.global.
переклади