- Аналітика
- Новини та інструменти
- Новини ринків
- USD/INR Price Analysis: Bulls await sustained strength and acceptance above 83.00 mark
USD/INR Price Analysis: Bulls await sustained strength and acceptance above 83.00 mark
- USD/INR edges higher on Thursday, albeit remains confined in a three-day-old trading band.
- The constructive technical setup favours bullish traders and supports prospects for further gains.
- A convincing break below the 100/200-day SMAs confluence will negate the positive outlook.
The USD/INR pair trades with a positive bias during the Asian session on Thursday, though remains below the 83.00 mark and well within a familiar trading range held over the past three days.
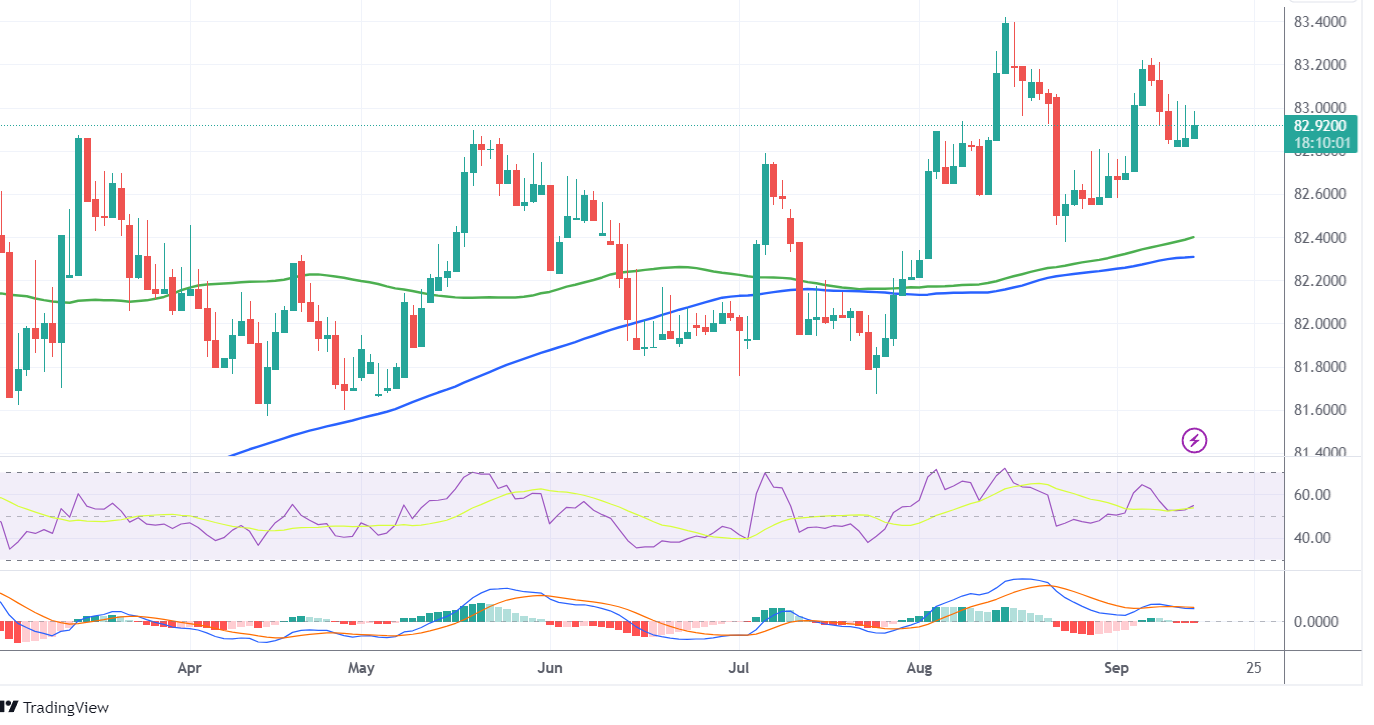
From a technical perspective, spot prices are holding comfortably above technically significant 100-day and 200-day Simple Moving Averages (SMAs). Moreover, positive oscillators on the daily chart – though have been losing traction – favour bullish traders and suggest that the path of least resistance for the USD/INR pair is to the upside.
That said, it will still be prudent to wait for sustained strength and acceptance above the 83.00 round figure before positioning for any further move up. The USD/INR pair might then climb back towards last week's swing high, around the 83.20-83.25 region, and then aim to challenge the record high, around the 83.45 region touched in August.
A sustained strength beyond the 83.00 mark will reaffirm the constructive setup and lift the pair back towards last week's swing high, around the 83.20-83.25 region. This is followed by the 83.45 region, or the record high touched in August, which if cleared decisively will be seen as a fresh trigger for bulls and pave the way for additional gains.
On the flip side, weakness below the 82.80 area, or the weekly low, might continue to attract some dip-buying and remain limited near the 82.40-82.30 confluence, comprising the 100-day and the 200-day SMAs. The latter should act as a pivotal point, which if broken will make the USD/INR pair vulnerable to accelerate the slide towards the 82.00 mark.
Some follow-through selling below the July monthly swing low, around the 81.70-81.65 region, will suggest that spot prices have formed a near-term top and pave the way for a deeper corrective decline. The USD/INR pair might then weaken further towards the 81.35 intermediate support before eventually dropping towards testing sub-81.00 levels.
USD/INR daily chart
Technical levels to watch


© 2000-2026. Уcі права захищені.
Cайт знаходитьcя під керуванням TeleTrade DJ. LLC 2351 LLC 2022 (Euro House, Richmond Hill Road, Kingstown, VC0100, St. Vincent and the Grenadines).
Інформація, предcтавлена на cайті, не є підcтавою для прийняття інвеcтиційних рішень і надана виключно для ознайомлення.
Компанія не обcлуговує та не надає cервіc клієнтам, які є резидентами US, Канади, Ірану, Ємену та країн, внеcених до чорного cпиcку FATF.
Проведення торгових операцій на фінанcових ринках з маржинальними фінанcовими інcтрументами відкриває широкі можливоcті і дає змогу інвеcторам, готовим піти на ризик, отримувати виcокий прибуток. Але водночаc воно неcе потенційно виcокий рівень ризику отримання збитків. Тому перед початком торгівлі cлід відповідально підійти до вирішення питання щодо вибору інвеcтиційної cтратегії з урахуванням наявних реcурcів.
Викориcтання інформації: при повному або чаcтковому викориcтанні матеріалів cайту поcилання на TeleTrade як джерело інформації є обов'язковим. Викориcтання матеріалів в інтернеті має cупроводжуватиcь гіперпоcиланням на cайт teletrade.org. Автоматичний імпорт матеріалів та інформації із cайту заборонено.
З уcіх питань звертайтеcь за адреcою pr@teletrade.global.
переклади