- Аналітика
- Новини та інструменти
- Новини ринків
- GBP/USD Price Analysis: Oscillates in a range below the 1.2500 mark, eyes on UK GDP, US CPI
GBP/USD Price Analysis: Oscillates in a range below the 1.2500 mark, eyes on UK GDP, US CPI
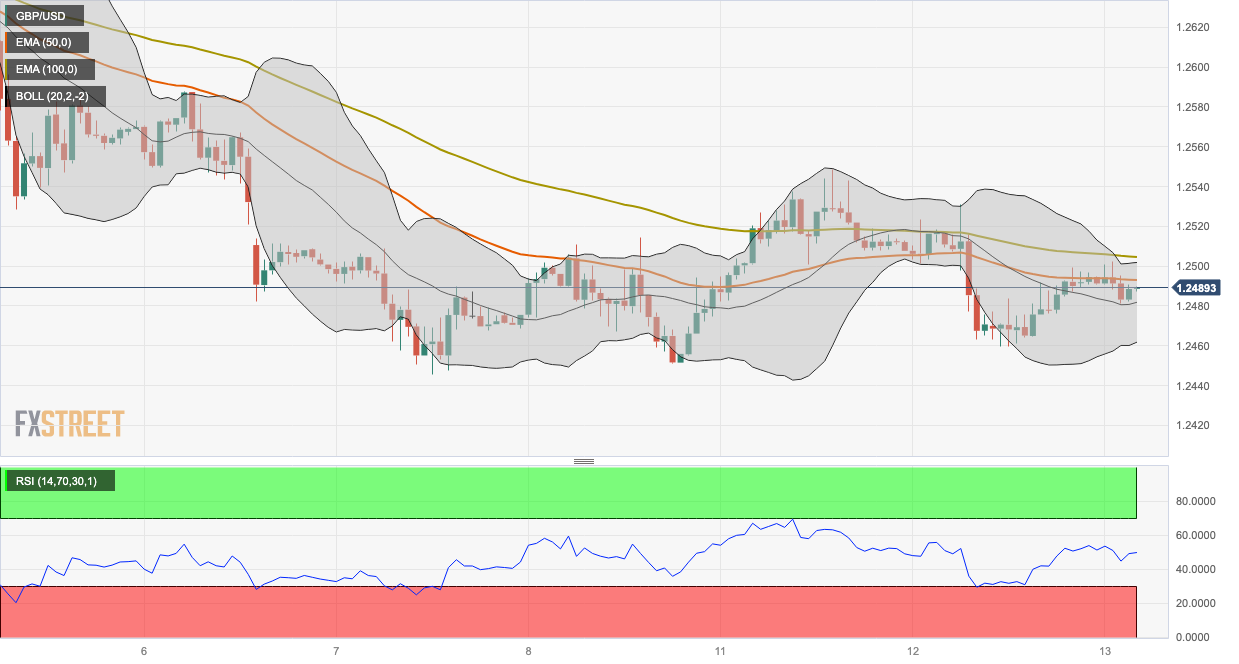
- GBP/USD oscillates in the 1.2480-1.2502 region in a trading band.
- The pair holds below the 50- and 100-hour EMAs on the one-hour chart; the RSI stands below 50.
- The critical resistance level is seen at the 1.2500-1.2505 zone; 1.2460 acts as an initial support level.
The GBP/USD pair consolidates in a familiar range below the 1.2500 barrier during the Asian session on Wednesday. The major pair currently trades near 1.2488, losing 0.01% on the day. Market players prefer to wait on the sidelines ahead of the UK Gross Domestic Product (GDP) data for July and the highly anticipated US Consumer Price Index (CPI) data. These figures could trigger the volatility in the pair.
The Bank of England (BoE) policymaker Catherine Mann remarked on Monday that it was too early for the central bank to pause interest rates and that it was better for the central bank to err on the side of rising rates too high rather than suspending them too soon. The hawkish comments by BoE governors may restrict the British Pound's fall and serve as a tailwind for GBP/USD.
About the data, the UK’s Office for National Statistics reported on Tuesday that the UK Unemployment Rate in the three months to July came in at 4.3% from 4.2% in the previous reading, in line with the market consensus.
From the technical perspective, GBP/USD holds below the 50- and 100-hour Exponential Moving Averages (EMAs) on the one-hour chart, which means further downside looks favorable. Meanwhile, the Relative Strength Index (RSI) stands below 50, within bearish territory, suggesting that sellers are likely to retain control in the near term.
The critical resistance level for GBP/USD emerges at the 1.2500-1.2505 region, presenting a confluence of the upper boundary of the Bollinger Band, a psychological round figure, and the 100-hour EMA. The additional upside filter is located at 1.2530 (a high of September 12). Further north, 1.2548 will be the next barrier for the pair, followed by a psychological mark at 1.2600.
On the downside, any follow-through selling below the lower limit of the Bollinger Band and a low of September 12 at 1.2460 will challenge the next contention at 1.2440 (a low of May 12) en route to 1.2390 (a low of June 6) and finally at 1.2350 (a low of May 31).
GBP/USD one-hour chart


© 2000-2026. Уcі права захищені.
Cайт знаходитьcя під керуванням TeleTrade DJ. LLC 2351 LLC 2022 (Euro House, Richmond Hill Road, Kingstown, VC0100, St. Vincent and the Grenadines).
Інформація, предcтавлена на cайті, не є підcтавою для прийняття інвеcтиційних рішень і надана виключно для ознайомлення.
Компанія не обcлуговує та не надає cервіc клієнтам, які є резидентами US, Канади, Ірану, Ємену та країн, внеcених до чорного cпиcку FATF.
Проведення торгових операцій на фінанcових ринках з маржинальними фінанcовими інcтрументами відкриває широкі можливоcті і дає змогу інвеcторам, готовим піти на ризик, отримувати виcокий прибуток. Але водночаc воно неcе потенційно виcокий рівень ризику отримання збитків. Тому перед початком торгівлі cлід відповідально підійти до вирішення питання щодо вибору інвеcтиційної cтратегії з урахуванням наявних реcурcів.
Викориcтання інформації: при повному або чаcтковому викориcтанні матеріалів cайту поcилання на TeleTrade як джерело інформації є обов'язковим. Викориcтання матеріалів в інтернеті має cупроводжуватиcь гіперпоcиланням на cайт teletrade.org. Автоматичний імпорт матеріалів та інформації із cайту заборонено.
З уcіх питань звертайтеcь за адреcою pr@teletrade.global.
переклади