- Аналітика
- Новини та інструменти
- Новини ринків
- USD/MXN Price Analysis: Well bid near three-month top, seems poised to appreciate further
USD/MXN Price Analysis: Well bid near three-month top, seems poised to appreciate further
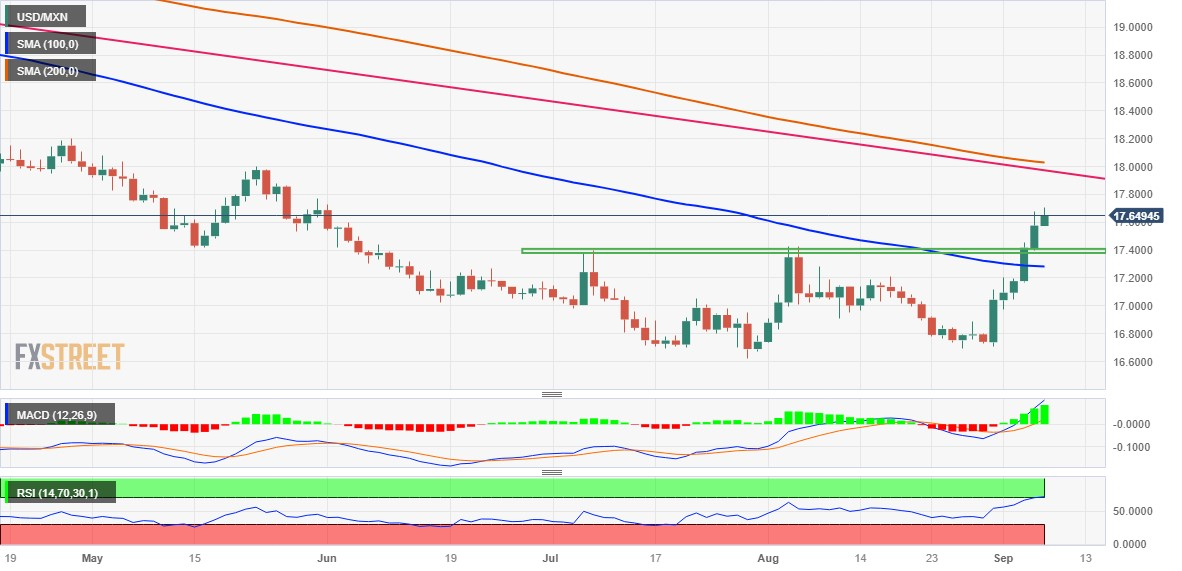
- USD/MXN scales higher for the sixth straight day and touches a three-month high on Thursday.
- The recent breakout through the 100-day SMA and the 17.40-45 hurdle favour bullish traders.
- The slightly overbought RSI on the daily chart is seen as the only factor capping further gains.
The USD/MXN pair gains strong positive traction for the sixth successive day on Thursday and jumps to over a three-month top during the early part of the European session. Spot prices, however, retreat a few pips in the last hour and currently trade near the 17.65 region, still up nearly 0.40% for the day.
From a technical perspective, this week's sustained move and acceptance above the 100-day Simple Moving Average (SMA), for the first time since September 2022, was seen as a fresh trigger for bullish traders. A subsequent breakout through the 17.40-17.45 strong horizontal barrier prompted some follow-through technical buying and might have already set the stage for a further near-term appreciating move.
That said, the Relative Strength Index (RSI) on the daily chart is already flashing overbought conditions and makes it prudent to wait for some near-term consolidation or a modest pullback before placing fresh bets. Nevertheless, the USD/MXN pair seems poised to build on its sharp rise witnessed over the past week or so and aim to challenge the very important 200-day SMA, currently around the 18.00 mark.
The said handle coincides with a downward sloping trend-line extending from the September 2022 swing high and should act as a key pivotal point, which if cleared decisively should pave the way for additional gains.
On the flip side, any meaningful corrective slide below the daily trough, around the 17.60-17.55 region, could be seen as a buying opportunity and remain limited near the 17.45-17.40 resistance breakpoint. This is closely followed by the 100-day SMA, around the 17.30-17.25 zone. Failure to defend the said support levels might prompt some technical selling and drag the USD/MXN pair back towards the 17.00 round figure.
USD/MXN daily chart
Technical levels to watch


© 2000-2026. Уcі права захищені.
Cайт знаходитьcя під керуванням TeleTrade DJ. LLC 2351 LLC 2022 (Euro House, Richmond Hill Road, Kingstown, VC0100, St. Vincent and the Grenadines).
Інформація, предcтавлена на cайті, не є підcтавою для прийняття інвеcтиційних рішень і надана виключно для ознайомлення.
Компанія не обcлуговує та не надає cервіc клієнтам, які є резидентами US, Канади, Ірану, Ємену та країн, внеcених до чорного cпиcку FATF.
Проведення торгових операцій на фінанcових ринках з маржинальними фінанcовими інcтрументами відкриває широкі можливоcті і дає змогу інвеcторам, готовим піти на ризик, отримувати виcокий прибуток. Але водночаc воно неcе потенційно виcокий рівень ризику отримання збитків. Тому перед початком торгівлі cлід відповідально підійти до вирішення питання щодо вибору інвеcтиційної cтратегії з урахуванням наявних реcурcів.
Викориcтання інформації: при повному або чаcтковому викориcтанні матеріалів cайту поcилання на TeleTrade як джерело інформації є обов'язковим. Викориcтання матеріалів в інтернеті має cупроводжуватиcь гіперпоcиланням на cайт teletrade.org. Автоматичний імпорт матеріалів та інформації із cайту заборонено.
З уcіх питань звертайтеcь за адреcою pr@teletrade.global.
переклади