- Аналітика
- Новини та інструменти
- Новини ринків
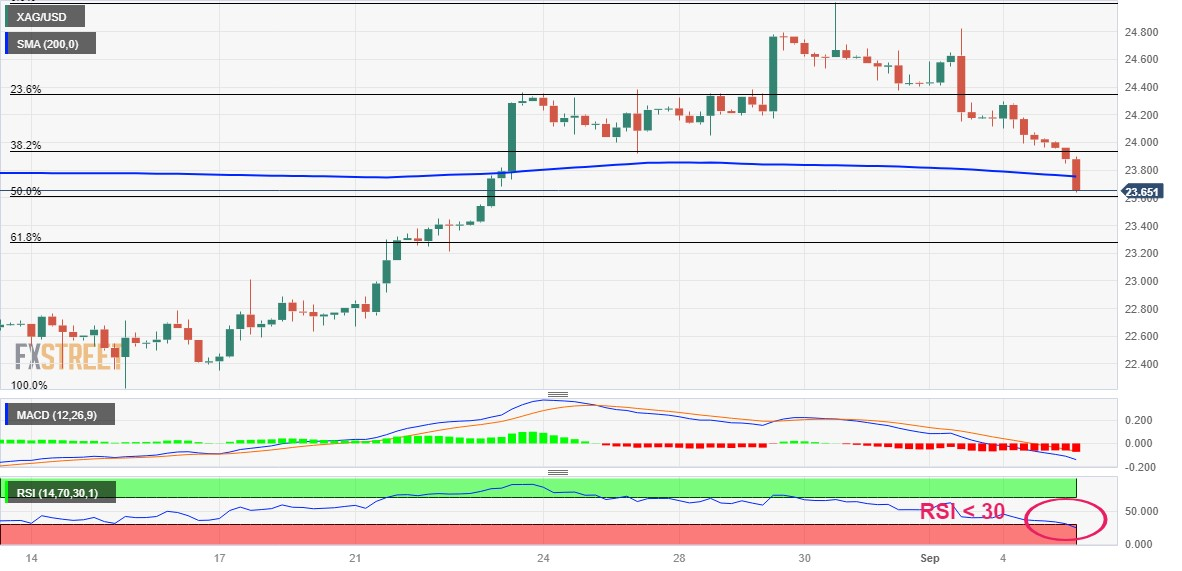
- Silver Price Analysis: XAG/USD plummets to two-week low, bears flirt with 50% Fibo.
Silver Price Analysis: XAG/USD plummets to two-week low, bears flirt with 50% Fibo.
- Silver remains under heavy selling pressure for the fifth straight day on Tuesday.
- A sustained break below the 200-period SMA on the 4-hour chart favours bears.
- The oversold RSI on hourly charts makes it prudent to wait for some consolidation.
Silver prolongs last week's rejection slide from the $25.00 psychological mark, or over a one-month peak and continues to lose ground for the fifth successive day on Tuesday. The downfall remains uninterrupted through the early European session and drags the white metal to a two-week low, around the $23.65 region in the last hour.
From a technical perspective, sustained break and acceptance below the $23.80-$23.75 area, representing the 200-period Simple Moving Average (SMA) on the 4-hour chart could be seen as a fresh trigger for bearish traders. Moreover, oscillators on the daily chart have just started gaining negative traction and support prospects for a further near-term depreciating move. That said, the Relative Strength Index (RSI) on hourly charts is flashing oversold conditions and might assist the XAG/USD to consolidate near current levels, representing the 50% Fibonacci retracement level of $22.25-$25.00 rally.
A convincing break below, however, will make silver vulnerable to accelerate the fall towards the 61.8% Fibo. level, around the $23.30-$23.25 region en route to the $23.00 round-figure mark. The downward trajectory could get extended further and drag the XAG/USD further below the $22.65-$22.60 area, towards challenging a strong horizontal support near the $22.20-$22.10 zone.
On the flip side, the 200-period SMA breakpoint, around the $23.75-$23.80 region, now seems to act as an immediate barrier ahead of the $24.00 round-figure mark. The latter represents the 38.2% Fibo. level, above which a bout of a short-covering move has the potential to lift the XAG/USD towards the 23.6% Fibo. level, around the $24.30-$24.35 area. Some follow-through buying might expose a four-month-old descending trend line resistance, currently near the $24.70-$24.75 zone. A sustained breakthrough, leading to a subsequent strength beyond the $25.00 mark, might shift the bias in favour of bullish traders.
Silver 4-hour chart
Technical levels to watch


© 2000-2026. Уcі права захищені.
Cайт знаходитьcя під керуванням TeleTrade DJ. LLC 2351 LLC 2022 (Euro House, Richmond Hill Road, Kingstown, VC0100, St. Vincent and the Grenadines).
Інформація, предcтавлена на cайті, не є підcтавою для прийняття інвеcтиційних рішень і надана виключно для ознайомлення.
Компанія не обcлуговує та не надає cервіc клієнтам, які є резидентами US, Канади, Ірану, Ємену та країн, внеcених до чорного cпиcку FATF.
Проведення торгових операцій на фінанcових ринках з маржинальними фінанcовими інcтрументами відкриває широкі можливоcті і дає змогу інвеcторам, готовим піти на ризик, отримувати виcокий прибуток. Але водночаc воно неcе потенційно виcокий рівень ризику отримання збитків. Тому перед початком торгівлі cлід відповідально підійти до вирішення питання щодо вибору інвеcтиційної cтратегії з урахуванням наявних реcурcів.
Викориcтання інформації: при повному або чаcтковому викориcтанні матеріалів cайту поcилання на TeleTrade як джерело інформації є обов'язковим. Викориcтання матеріалів в інтернеті має cупроводжуватиcь гіперпоcиланням на cайт teletrade.org. Автоматичний імпорт матеріалів та інформації із cайту заборонено.
З уcіх питань звертайтеcь за адреcою pr@teletrade.global.
переклади