- Аналітика
- Новини та інструменти
- Новини ринків
- Silver Price Analysis: XAG/USD retreats from multi-week top, holds above $24.00 mark
Silver Price Analysis: XAG/USD retreats from multi-week top, holds above $24.00 mark
- Silver edges lower on Monday and corrects further from over a three-month high.
- The 200-period SMA on the 4-hour chart to act as a pivotal point and limit losses.
- Bulls might wait for a move beyond the $24.35-40 area before placing fresh bets.
Silver attracts some intraday selling on the first day of a new week and moves away from over a three-week high, around the $24.35-$24.40 region touched on Friday. The white metal sticks to a mildly negative tone through the early part of the European session, albeit manages to hold its neck above the $24.00 round-figure mark.
Any subsequent slide below the aforementioned handle is more likely to find some support near the $23.85-$23.80 area, or the 200-period Simple Moving Average (SMA) on the 4-hour chart. Against the backdrop of positive technical indicators on 4-hour/daily charts, the said area could act as a pivotal point for intraday traders and help limit any further decline.
Silver 4-hour chart
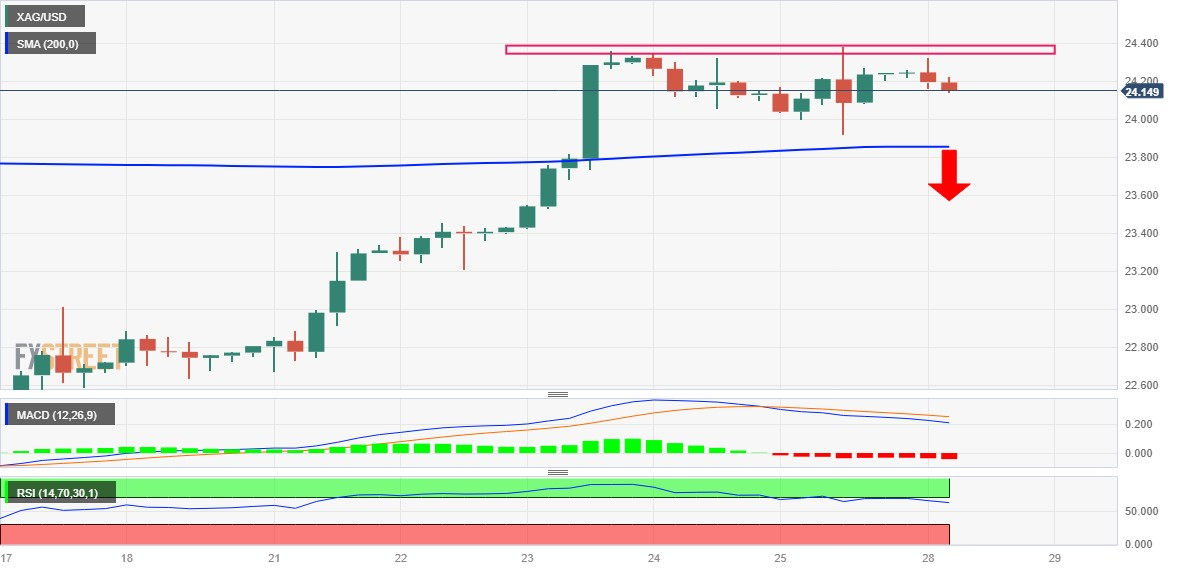
A sustained break below, however, might prompt some technical selling and drag the XAG/USD towards the $23.55 region. This is closely followed by support near the $23.40 area, representing the 200-day SMA, which if broken decisively might shift the near-term bias in favour of bearish traders and pave the way for some meaningful downside.
On the flip side, the $24.35-$24.40 area might continue to act as an immediate strong resistance, which if cleared should allow the XAG/USD to surpass the $24.55-$24.60 intermediate hurdle and aim to reclaim the $25.00 psychological mark. The positive move could get extended further towards the $25.25 zone, or the July monthly swing high, en route to the $26.00 mark.
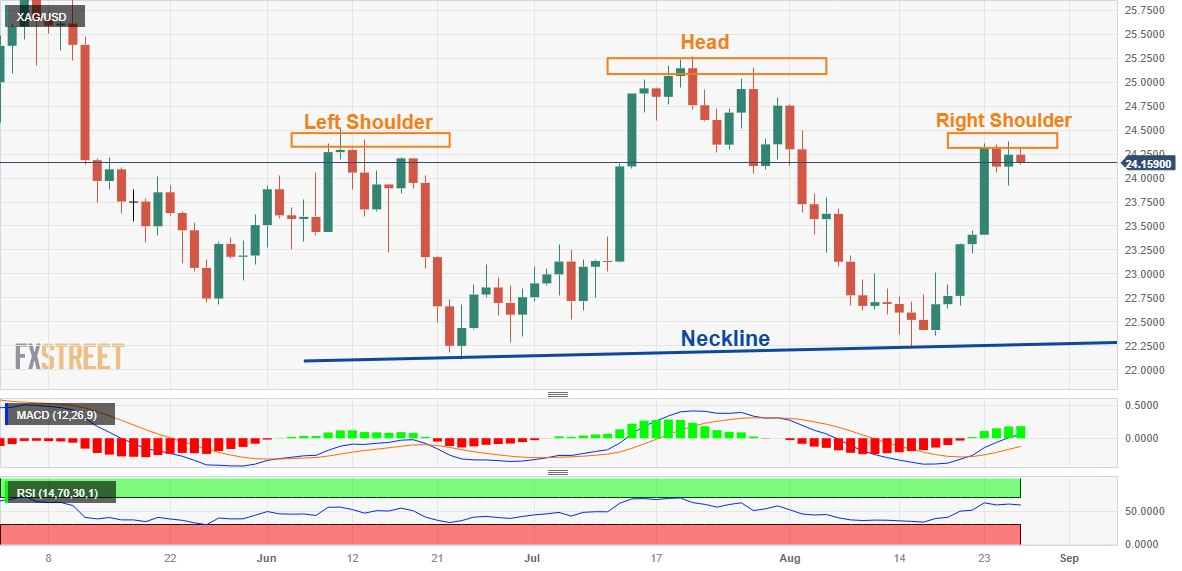
Zooming out to the daily chart, the recent price action witnessed since early June seems to constitute the formation of a bearish head and shoulders pattern on the daily chart. The pattern, however, will be confirmed on a sustained break below the neckline support, around the $22.20-$22.10 region.
XAG/USD daily chart
Key levels to watch


© 2000-2026. Уcі права захищені.
Cайт знаходитьcя під керуванням TeleTrade DJ. LLC 2351 LLC 2022 (Euro House, Richmond Hill Road, Kingstown, VC0100, St. Vincent and the Grenadines).
Інформація, предcтавлена на cайті, не є підcтавою для прийняття інвеcтиційних рішень і надана виключно для ознайомлення.
Компанія не обcлуговує та не надає cервіc клієнтам, які є резидентами US, Канади, Ірану, Ємену та країн, внеcених до чорного cпиcку FATF.
Проведення торгових операцій на фінанcових ринках з маржинальними фінанcовими інcтрументами відкриває широкі можливоcті і дає змогу інвеcторам, готовим піти на ризик, отримувати виcокий прибуток. Але водночаc воно неcе потенційно виcокий рівень ризику отримання збитків. Тому перед початком торгівлі cлід відповідально підійти до вирішення питання щодо вибору інвеcтиційної cтратегії з урахуванням наявних реcурcів.
Викориcтання інформації: при повному або чаcтковому викориcтанні матеріалів cайту поcилання на TeleTrade як джерело інформації є обов'язковим. Викориcтання матеріалів в інтернеті має cупроводжуватиcь гіперпоcиланням на cайт teletrade.org. Автоматичний імпорт матеріалів та інформації із cайту заборонено.
З уcіх питань звертайтеcь за адреcою pr@teletrade.global.
переклади