- Аналітика
- Новини та інструменти
- Новини ринків
- GBP/JPY Price Analysis: Remains on the defensive around 185.20 ahead of UK Retail Sales
GBP/JPY Price Analysis: Remains on the defensive around 185.20 ahead of UK Retail Sales
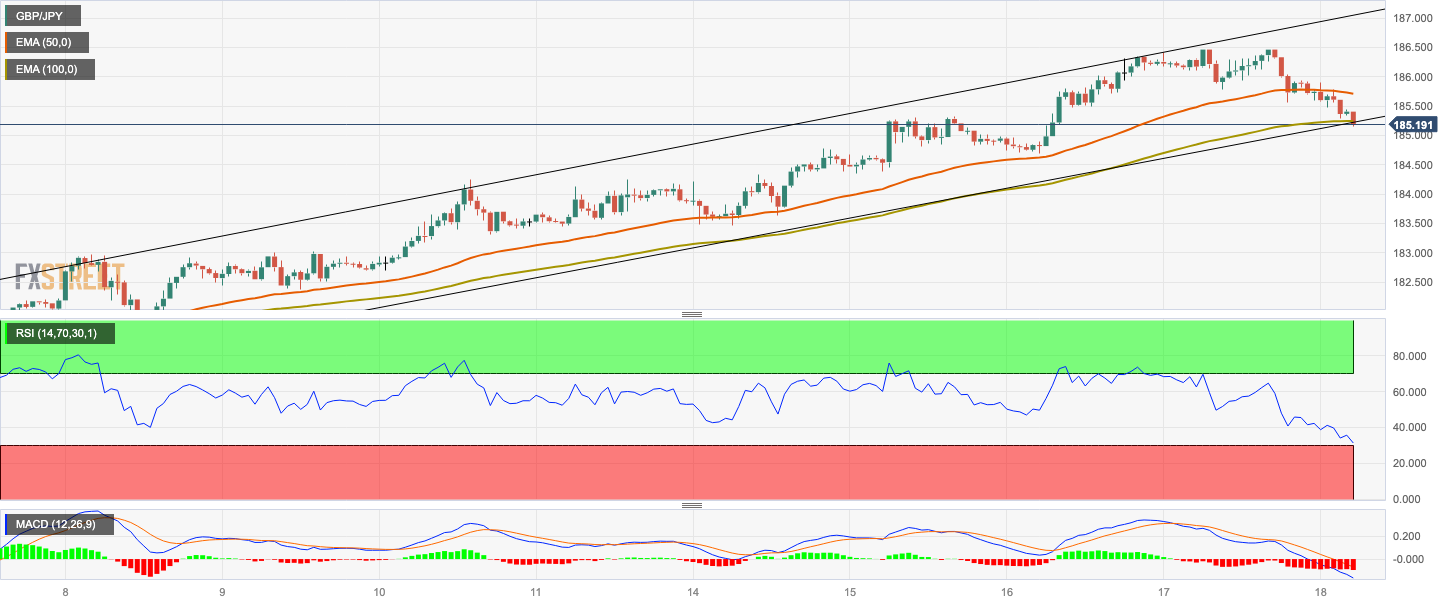
- GBP/JPY cross trades within an ascending trend-channel on the one-hour chart.
- The next support level is located at 184.35; the first resistance level is seen at 185.70.
- The Relative Strength Index (RSI) and MACD stand in bearish territory.
The GBP/JPY cross remains under pressure for the second consecutive day heading into the early European session on Friday. Market turn cautious amid the fear of China’s debt crisis and real-estate woes, which boost the Japanese Yen, a traditional safe-haven currency. However, the release of the UK Retail Sales could provide a clear direction for the cross.
On Thursday, Evergrande, China’s second-largest real estate company filed for bankruptcy in a US court under Chapter 15. This report fuels the fear of a potential Chinese property catastrophe. Furthermore, Fitch Ratings revealed on the same day that they might reconsider China's A+ sovereign credit rating in the face of intensifying economic headwinds. This, in turn, exerts pressure on the Pound Sterling and acts as a headwind for GBP/JPY.
From the technical perspective, the GBP/JPY cross trades within an ascending trend-channel since August 4 on the one-hour chart. The cross stands below the 50- and 100-hour Exponential Moving Averages (EMAs) with a downward slope, which means the path of the least resistance is to the downside.
That said, a decisive break below 185.20 (the lower limit of the ascending trend-channel and 100-hour EMA) will see a drop to 184.70 (low of August 16). The next contention is located at 184.35 (high of August 14). The additional downside filter to watch is the 184.00–184.10 region, representing a psychological round figure. The key support level is located at 183.00, portraying a confluence of a high of August 8 and the round mark.
On the upside, GBP/JPY’s immediate resistance level is seen at 185.70 (50-hour EMA). Any meaningful follow-through buying will see the next stop at 186.35 (a weekly high of December 4, 2015). The critical barrier is seen at 187.00 (a round figure and a weekly high of November 27, 2015).
It’s worth noting that the Relative Strength Index (RSI) is located below 50, while the Moving Average Convergence/Divergence (MACD) stand in bearish territory. Both momentum indicators highlight that further downside cannot be ruled out.
GBP/JPY one-hour chart


© 2000-2026. Уcі права захищені.
Cайт знаходитьcя під керуванням TeleTrade DJ. LLC 2351 LLC 2022 (Euro House, Richmond Hill Road, Kingstown, VC0100, St. Vincent and the Grenadines).
Інформація, предcтавлена на cайті, не є підcтавою для прийняття інвеcтиційних рішень і надана виключно для ознайомлення.
Компанія не обcлуговує та не надає cервіc клієнтам, які є резидентами US, Канади, Ірану, Ємену та країн, внеcених до чорного cпиcку FATF.
Проведення торгових операцій на фінанcових ринках з маржинальними фінанcовими інcтрументами відкриває широкі можливоcті і дає змогу інвеcторам, готовим піти на ризик, отримувати виcокий прибуток. Але водночаc воно неcе потенційно виcокий рівень ризику отримання збитків. Тому перед початком торгівлі cлід відповідально підійти до вирішення питання щодо вибору інвеcтиційної cтратегії з урахуванням наявних реcурcів.
Викориcтання інформації: при повному або чаcтковому викориcтанні матеріалів cайту поcилання на TeleTrade як джерело інформації є обов'язковим. Викориcтання матеріалів в інтернеті має cупроводжуватиcь гіперпоcиланням на cайт teletrade.org. Автоматичний імпорт матеріалів та інформації із cайту заборонено.
З уcіх питань звертайтеcь за адреcою pr@teletrade.global.
переклади