- Аналітика
- Новини та інструменти
- Новини ринків
- AUD/USD Price Analysis: Struggles to gain near 0.6530, all eyes are on US PPI
AUD/USD Price Analysis: Struggles to gain near 0.6530, all eyes are on US PPI
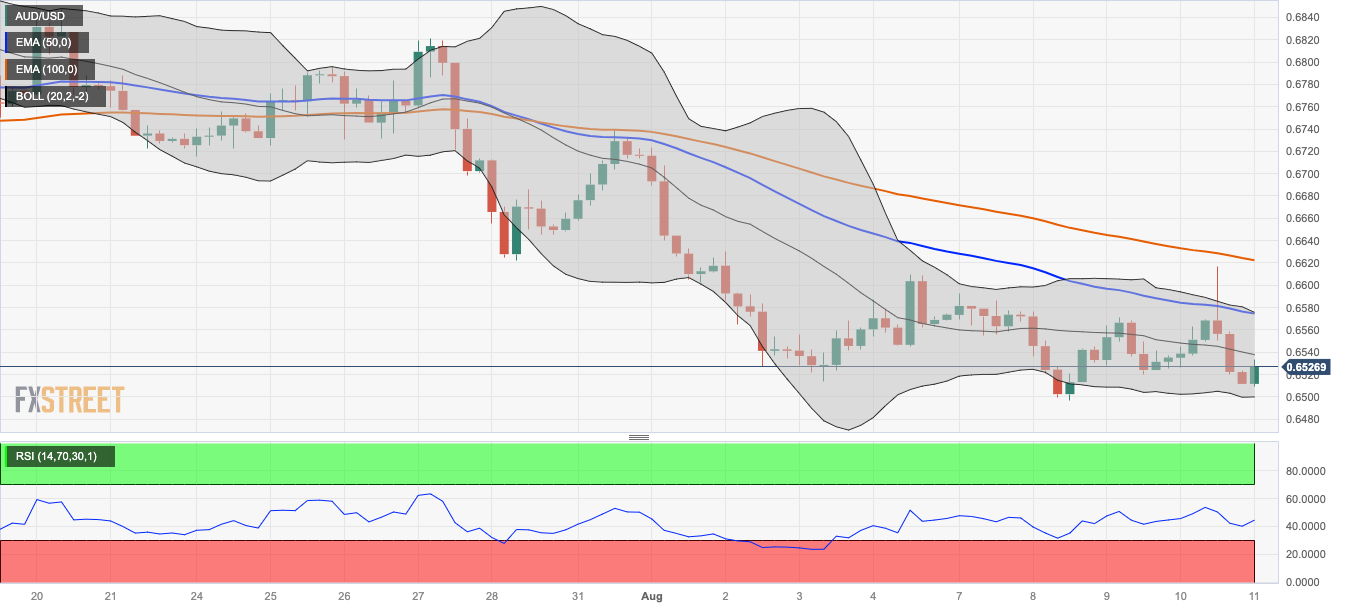
- AUD/USD remains on the defensive around 0.6525, up 0.14% ahead of the top-tier US data.
- The pair trades below the 50- and 100-hour EMAs with a downward slope on the four-hour chart.
- The immediate resistance is located at 0.6540; 0.6500 acts as the key support level.
The AUD/USD pair remains under pressure in the Asian session as investors are concerned about the possible deflation in China and the hawkish comments from Federal Reserve policymakers. The major pair currently trades around 0.6525, gaining 0.14% on the day.
That said, the Fed San Francisco President, Mary C. Daly, stated on Thursday that there is a lot more information to evaluate and that it is premature to project whether additional rate increases or a prolonged period of holding rates are required. This, in turn, caps the upside for the Aussie and acts as a headwind for the pair. On Friday, market players await the US Producer Price Index (PPI), due later in the American session. The figure is expected to rise from 0.1% to 0.7% YoY. Also, the University of Michigan (UoM) Consumer Confidence Survey will be due in the American session.
Technically, the AUD/USD pair trades below the 50- and 100-hour Exponential Moving Averages (EMAs) with a downward slope on the four-hour chart, indicating that the path of least resistance for the pair is to the downside.
Any meaningful follow-through buying beyond 0.6540 (the midline of the Bollinger Band) could pave the way to the next resistance level at 0.6575. This level represents a confluence of the upper boundary of the Bollinger Band and the 50-hour EMA. A break above the latter will see the next upside stop at 0.662 (100-hour EMA), and finally the key barrier is seen at 0.6700 (a psychological round mark).
On the flip side, 0.6500 acts as the critical support level for the pair, portraying the lower limit of the Bollinger Band, a low of August 3, and a psychological round mark. Any intraday pullback below the latter would expose the next contention level at 0.6460 (low of May 31) Further south, the next stop of the AUD/USD is located at 0.6400 (the confluence of a psychological round figure and the low of November 2022).
It’s worth noting that the Relative Strength Index (RSI) stands below 50, challenging the pair’s immediate downside for the time being.
AUD/USD four-hour chart


© 2000-2026. Уcі права захищені.
Cайт знаходитьcя під керуванням TeleTrade DJ. LLC 2351 LLC 2022 (Euro House, Richmond Hill Road, Kingstown, VC0100, St. Vincent and the Grenadines).
Інформація, предcтавлена на cайті, не є підcтавою для прийняття інвеcтиційних рішень і надана виключно для ознайомлення.
Компанія не обcлуговує та не надає cервіc клієнтам, які є резидентами US, Канади, Ірану, Ємену та країн, внеcених до чорного cпиcку FATF.
Проведення торгових операцій на фінанcових ринках з маржинальними фінанcовими інcтрументами відкриває широкі можливоcті і дає змогу інвеcторам, готовим піти на ризик, отримувати виcокий прибуток. Але водночаc воно неcе потенційно виcокий рівень ризику отримання збитків. Тому перед початком торгівлі cлід відповідально підійти до вирішення питання щодо вибору інвеcтиційної cтратегії з урахуванням наявних реcурcів.
Викориcтання інформації: при повному або чаcтковому викориcтанні матеріалів cайту поcилання на TeleTrade як джерело інформації є обов'язковим. Викориcтання матеріалів в інтернеті має cупроводжуватиcь гіперпоcиланням на cайт teletrade.org. Автоматичний імпорт матеріалів та інформації із cайту заборонено.
З уcіх питань звертайтеcь за адреcою pr@teletrade.global.
переклади