- Аналітика
- Новини та інструменти
- Новини ринків
- EUR/USD Price Analysis: Bounces from one-month-low as doji emerges at around 1.0940s
EUR/USD Price Analysis: Bounces from one-month-low as doji emerges at around 1.0940s
- EUR/USD falls to 1.0912 but rebounds before breaching 1.0900, trading at 1.0942 with a slight gain of 0.04% on Thursday.
- A potential doji formation shows market indecision; the pair might consolidate within the 1.0900/1.1000 range, with 100-day EMA at 1.0894 as a key support level.
- Resistance lies at 1.0971 (50-day EMA), with further upside targets at 1.1000, 1.1020 (29-day EMA), and 1.1100. Conversely, a breach below the 100-day EMA could lead to further losses toward 1.0833 and 1.0800.
The EUR/USD fell to a one-month-low of 1.0912 but bounced before breaching below the 1.0900 figure and is gaining traction, as the major gains 0.04% on Thursday. Hence, the EUR/USD is trading at 1.0942, about to form a doji, which depicts indecision among buyers and sellers.
EUR/USD Price Analysis: Technical outlook
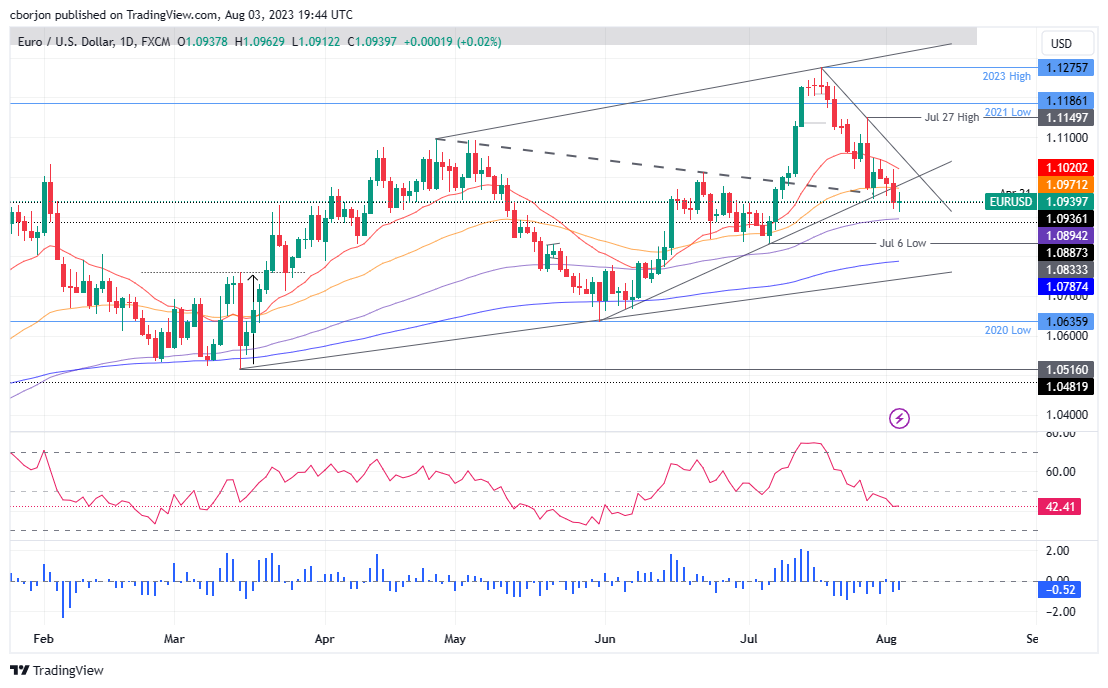
It should be said the EUR/USD dropped below the 50-day Exponential Moving Average (EMA) at 1.0871, suggesting the pair is accelerating its downtrend, but the 100-day EMA at 1.0894 capped the EUR/USD’s fall to test the July 6 swing low of 1.0833. Despite the fact that the EUR/USD’s scenario is turning bearish, the pair might consolidate within the 1.0900/1.1000 area, as a downslope trendline passes around 1.1000, while the 100-day EMA could cushion the EUR/USD around 1.0900.
However, if EUR/USD extends its losses past the latter, the 100-day EMA around 1.0894 would be tested. A breach of the latter would immediately expose the July 6 low at 1.0833, followed by the 1.0800 figure, ahead of the 200-day EMA.
Conversely, if the EUR/USD reclaims the 50-day EMA at 1.0971, the 1,1000 figure would be up for grabs. Break above would set the stage to test the 29-day EMA at 1.1020, followed by the 1.1100 mark.
Oscillator-wise, the Relative Strength Index (RSI) remains in bearish territory, but its slope is almost turning neutral. The three-day Rate of Change (RoC) portrays a positive divergence, as the RoC aims upward, while EUR/USD’s price action extends its losses. Nevertheless, a doji emerging at around 1.0900 could signal buyers to enter the market.
EUR/USD Price Action – Daily chart


© 2000-2026. Уcі права захищені.
Cайт знаходитьcя під керуванням TeleTrade DJ. LLC 2351 LLC 2022 (Euro House, Richmond Hill Road, Kingstown, VC0100, St. Vincent and the Grenadines).
Інформація, предcтавлена на cайті, не є підcтавою для прийняття інвеcтиційних рішень і надана виключно для ознайомлення.
Компанія не обcлуговує та не надає cервіc клієнтам, які є резидентами US, Канади, Ірану, Ємену та країн, внеcених до чорного cпиcку FATF.
Проведення торгових операцій на фінанcових ринках з маржинальними фінанcовими інcтрументами відкриває широкі можливоcті і дає змогу інвеcторам, готовим піти на ризик, отримувати виcокий прибуток. Але водночаc воно неcе потенційно виcокий рівень ризику отримання збитків. Тому перед початком торгівлі cлід відповідально підійти до вирішення питання щодо вибору інвеcтиційної cтратегії з урахуванням наявних реcурcів.
Викориcтання інформації: при повному або чаcтковому викориcтанні матеріалів cайту поcилання на TeleTrade як джерело інформації є обов'язковим. Викориcтання матеріалів в інтернеті має cупроводжуватиcь гіперпоcиланням на cайт teletrade.org. Автоматичний імпорт матеріалів та інформації із cайту заборонено.
З уcіх питань звертайтеcь за адреcою pr@teletrade.global.
переклади