- Аналітика
- Новини та інструменти
- Новини ринків
- NZD/USD Price Analysis: Languishes near its lowest since late June, bears have the upper hand
NZD/USD Price Analysis: Languishes near its lowest since late June, bears have the upper hand
- NZD/USD remains depressed for the third straight day and hits a fresh multi-week low.
- The overnight breakdown through the 0.6145-0.6140 confluence favours bearish traders.
- Bears might now aim back to retest sub-0.6000 levels, or the YTD trough touched in May.
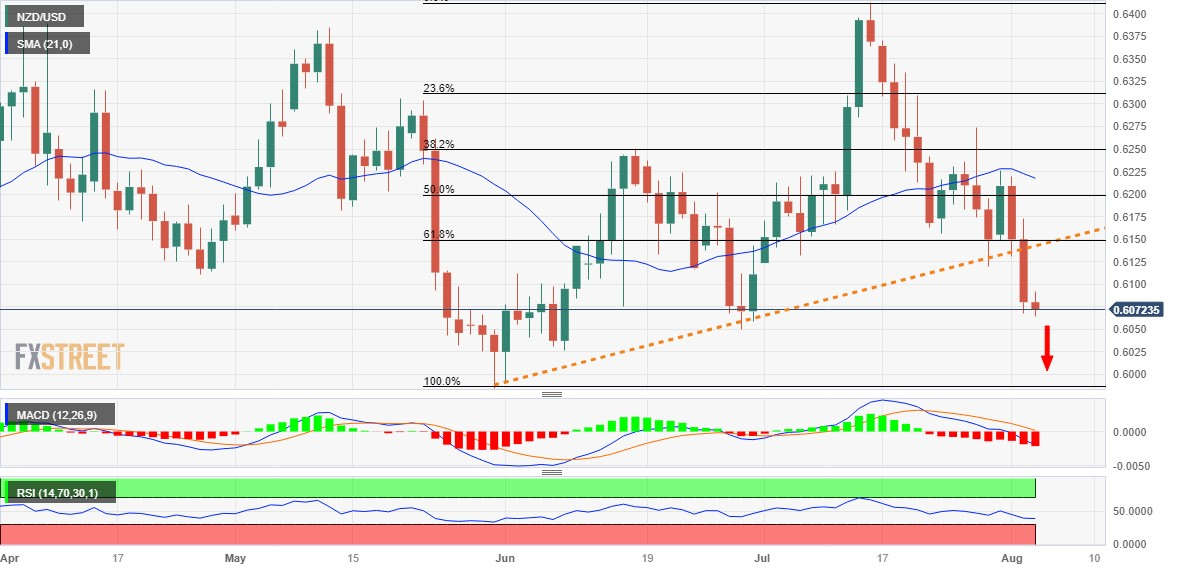
The NZD/USD pair edges lower for the third successive day – also marking the sixth day of a negative move in the previous seven – and drops to its lowest level since late June on Thursday. Spot prices remain on the defensive, around the 0.6070-0.6065 region through the early part of the European session and seem vulnerable to extending a three-week-old descending trend.
Against the backdrop of this week's failure near a technically significant 200-day Simple Moving Average (SMA), the overnight breakdown through the 0.6145-0.6140 confluence support was seen as a fresh trigger for bearish traders. The said area comprises the 61.8% Fibonacci retracement level of the May-July rally and an ascending trend-line extending from the YTD trough. This should now act as a pivotal point and cap any attempted recovery for the NZD/USD pair.
Meanwhile, technical indicators on the daily chart are holding deep in the negative territory and are still far from being in the oversold territory, adding credence to the bearish outlook for the NZD/USD pair. Some follow-through selling below the 0.6050 area (June 29 low) will reaffirm the negative bias and make spot prices vulnerable to accelerate the downward trajectory towards the 0.6000 psychological mark en route to the YTD low, around the 0.5985 region touched in May.
On the flip side, the 0.6100 round figure now seems to act as an immediate barrier ahead of the 0.6140-0.6145 confluence support breakpoint, now turned resistance. A sustained strength beyond might trigger a short-covering rally and allow the NZD/USD pair to aim back to reclaim the 0.6200 mark, which coincides with the 50% Fibo. level. This is closely followed by the 200-day SMA, around the 0.6220-0.6225 region, which if cleared could negate the negative outlook.
NZD/USD daily chart
Key levels to watch


© 2000-2026. Уcі права захищені.
Cайт знаходитьcя під керуванням TeleTrade DJ. LLC 2351 LLC 2022 (Euro House, Richmond Hill Road, Kingstown, VC0100, St. Vincent and the Grenadines).
Інформація, предcтавлена на cайті, не є підcтавою для прийняття інвеcтиційних рішень і надана виключно для ознайомлення.
Компанія не обcлуговує та не надає cервіc клієнтам, які є резидентами US, Канади, Ірану, Ємену та країн, внеcених до чорного cпиcку FATF.
Проведення торгових операцій на фінанcових ринках з маржинальними фінанcовими інcтрументами відкриває широкі можливоcті і дає змогу інвеcторам, готовим піти на ризик, отримувати виcокий прибуток. Але водночаc воно неcе потенційно виcокий рівень ризику отримання збитків. Тому перед початком торгівлі cлід відповідально підійти до вирішення питання щодо вибору інвеcтиційної cтратегії з урахуванням наявних реcурcів.
Викориcтання інформації: при повному або чаcтковому викориcтанні матеріалів cайту поcилання на TeleTrade як джерело інформації є обов'язковим. Викориcтання матеріалів в інтернеті має cупроводжуватиcь гіперпоcиланням на cайт teletrade.org. Автоматичний імпорт матеріалів та інформації із cайту заборонено.
З уcіх питань звертайтеcь за адреcою pr@teletrade.global.
переклади