- Аналітика
- Новини та інструменти
- Новини ринків
- NZD/USD Price Analysis: Upside momentum seems faded above 0.6200
NZD/USD Price Analysis: Upside momentum seems faded above 0.6200
- NZD/USD feels selling pressure around 0.6230 as investors await Fed policy for further guidance.
- The USD Index has found some support near 101.10 as investors are hoping that Fed Powell will deliver hawkish guidance.
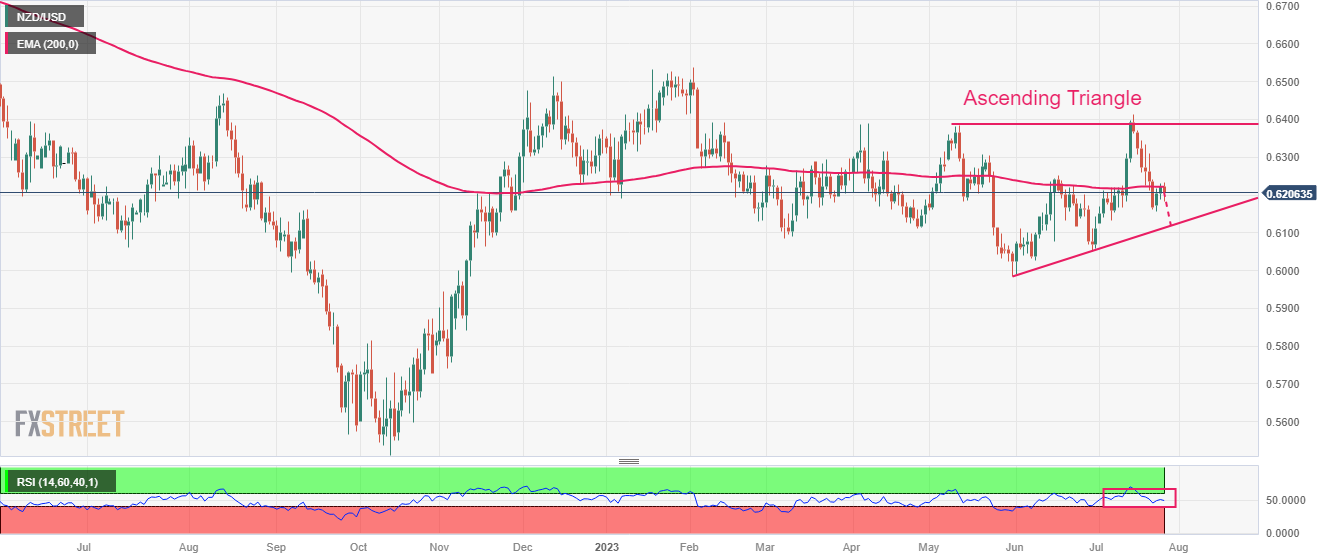
- NZD/USD is trading inside the Ascending Triangle chart pattern, which indicates a sheer contraction in volatility.
The NZD/USD pair senses selling pressure while attempting to climb above the immediate resistance of 0.6230 in the early New York session. The Kiwi asset has faced pressure as the US Dollar Index (DXY) has attempted a recovery ahead of the interest rate decision by the Federal Reserve (Fed).
Analysts at Danske Bank expect the Fed to hike interest rates for the final time by 25 bps and then go on hold. While economic activity has still held up well, easing underlying inflation and declining inflation expectations limit the need for further rate hikes. They further expect the immediate market reaction to be muted, with risks skewed towards a hawkish reaction, if Powell still maintains the door open for another hike.
The USD Index has found some support near 101.10 as investors are hoping that Fed Powell will deliver hawkish guidance. S&P500 is expected to open on a negative note, following weak cues from overnight futures.
NZD/USD is trading inside the Ascending Triangle chart pattern on a daily scale, which indicates a sheer contraction in volatility. The horizontal resistance of the aforementioned chart pattern is plotted from May 10 high at 0.6382 while the upward-sloping trendline is placed from May 31 low at 0.5985.
The Kiwi asset is facing resistance near the 200-period Exponential Moving Average (EMA) around 0.6226, which indicates that the long-term trend is bearish.
Meanwhile, the Relative Strength Index (RSI) (14) is oscillating in the 40.00-60.00 range, portraying a lackluster performance.
A decisive breakdown below the round-level support of 0.6200 would drag the asset toward July 26 low at 0.6156. A slippage below the latter would further drag the asset toward June 29 high around 0.6100.
Alternatively, a confident move above July 19 low at 0.6225 would send the major toward July 20 high marginally above 0.6300 followed by July 18 high at 0.6343.
NZD/USD daily chart


© 2000-2026. Уcі права захищені.
Cайт знаходитьcя під керуванням TeleTrade DJ. LLC 2351 LLC 2022 (Euro House, Richmond Hill Road, Kingstown, VC0100, St. Vincent and the Grenadines).
Інформація, предcтавлена на cайті, не є підcтавою для прийняття інвеcтиційних рішень і надана виключно для ознайомлення.
Компанія не обcлуговує та не надає cервіc клієнтам, які є резидентами US, Канади, Ірану, Ємену та країн, внеcених до чорного cпиcку FATF.
Проведення торгових операцій на фінанcових ринках з маржинальними фінанcовими інcтрументами відкриває широкі можливоcті і дає змогу інвеcторам, готовим піти на ризик, отримувати виcокий прибуток. Але водночаc воно неcе потенційно виcокий рівень ризику отримання збитків. Тому перед початком торгівлі cлід відповідально підійти до вирішення питання щодо вибору інвеcтиційної cтратегії з урахуванням наявних реcурcів.
Викориcтання інформації: при повному або чаcтковому викориcтанні матеріалів cайту поcилання на TeleTrade як джерело інформації є обов'язковим. Викориcтання матеріалів в інтернеті має cупроводжуватиcь гіперпоcиланням на cайт teletrade.org. Автоматичний імпорт матеріалів та інформації із cайту заборонено.
З уcіх питань звертайтеcь за адреcою pr@teletrade.global.
переклади