- Аналітика
- Новини та інструменти
- Новини ринків
- Natural Gas Price Analysis: XNG/USD clings to mild gains near $2.73, multi-month-old resistance line eyed
Natural Gas Price Analysis: XNG/USD clings to mild gains near $2.73, multi-month-old resistance line eyed
- Natural Gas Price remains on the front foot after refreshing two-week high.
- Clear upside break of three-week-old descending trend line, 61.8% Fibonacci retracement favors XNG/USD bulls.
- Bulls remain hopeful beyond a convergence of 100-SMA, 38.2% Fibonacci retracement.
Natural Gas Price (XNG/USD) edges higher past $2.72, staying firmer at the two-week high during the early hours of Friday’s Asian session. In doing so, the energy instrument clings to mild gains after rising the most in a month the previous day.
That said, a daily closing beyond the 61.8% Fibonacci retracement of the XNG/USD’s March-April downside, near $2.71, joins the upbeat RSI (14) line to keep the buyers hopeful.
Adding strength to the bullish bias is the commodity’s sustained U-turn from 100-DMA and a break of the previous resistance line stretched from June 26.
With this, the Natural Gas Price is expected to stretch the latest run-up towards the horizontal hurdle around $2.81 comprising the tops marked in May and late June.
Following that, an upward-sloping resistance line from March, close to $2.88, will be in the spotlight.
It’s worth noting that the RSI (14) may reach the overbought territory should the Natural Gas Price rise past $2.88, which in turn challenge the quote’s further upside then.
In a case where the XNG/USD remains firmer past $2.88, the tops marked in June and March, respectively near $2.93 and $3.08, may challenge the buyers before directing them to the yearly top.
On the contrary, the 61.8% Fibonacci retracement level of $2.71 acts as immediate support for the Natural Gas Price.
Following that, the previous resistance line and 50% Fibonacci retracement can challenge the XNG/USD bears around $2.60.
Above all, the Natural Gas buyers remain hopeful unless witnessing a daily closing beneath the 100-DMA and 38.2% Fibonacci retracement, close to $2.47 at the latest.
Natural Gas Price: Daily chart
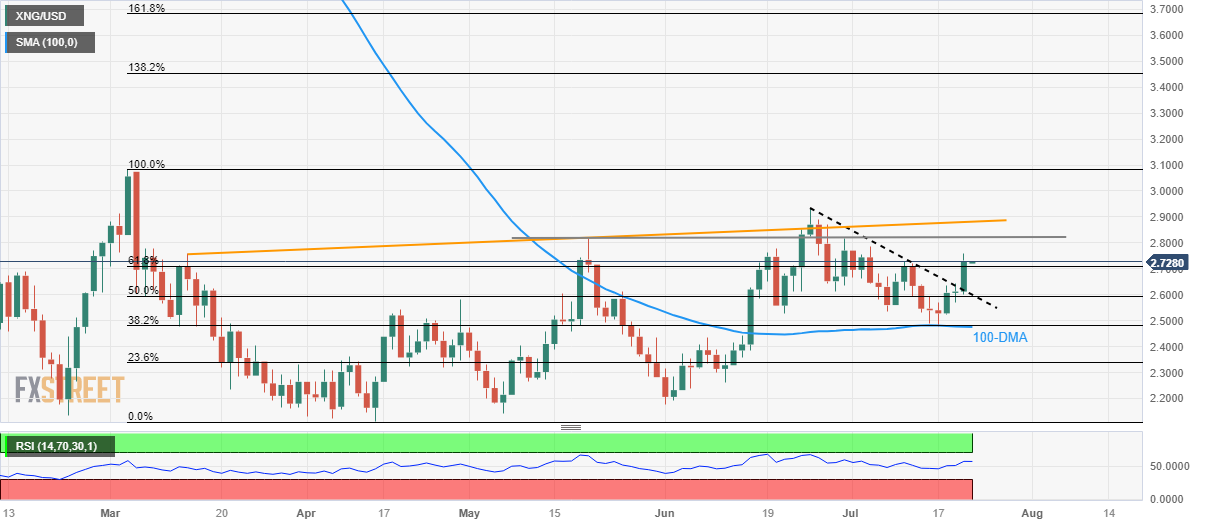
Trend: Further upside expected


© 2000-2026. Уcі права захищені.
Cайт знаходитьcя під керуванням TeleTrade DJ. LLC 2351 LLC 2022 (Euro House, Richmond Hill Road, Kingstown, VC0100, St. Vincent and the Grenadines).
Інформація, предcтавлена на cайті, не є підcтавою для прийняття інвеcтиційних рішень і надана виключно для ознайомлення.
Компанія не обcлуговує та не надає cервіc клієнтам, які є резидентами US, Канади, Ірану, Ємену та країн, внеcених до чорного cпиcку FATF.
Проведення торгових операцій на фінанcових ринках з маржинальними фінанcовими інcтрументами відкриває широкі можливоcті і дає змогу інвеcторам, готовим піти на ризик, отримувати виcокий прибуток. Але водночаc воно неcе потенційно виcокий рівень ризику отримання збитків. Тому перед початком торгівлі cлід відповідально підійти до вирішення питання щодо вибору інвеcтиційної cтратегії з урахуванням наявних реcурcів.
Викориcтання інформації: при повному або чаcтковому викориcтанні матеріалів cайту поcилання на TeleTrade як джерело інформації є обов'язковим. Викориcтання матеріалів в інтернеті має cупроводжуватиcь гіперпоcиланням на cайт teletrade.org. Автоматичний імпорт матеріалів та інформації із cайту заборонено.
З уcіх питань звертайтеcь за адреcою pr@teletrade.global.
переклади