- Аналітика
- Новини та інструменти
- Новини ринків
- Gold Price Forecast: XAU/USD gallops to near $1,950 as US inflation softens beyond expectations
Gold Price Forecast: XAU/USD gallops to near $1,950 as US inflation softens beyond expectations
- Gold price has climbed strongly to $1,950.00 as US inflation has softened more than expectations.
- The US Dollar Index has plunged as the Fed would have the luxury of skipping interest rates further.
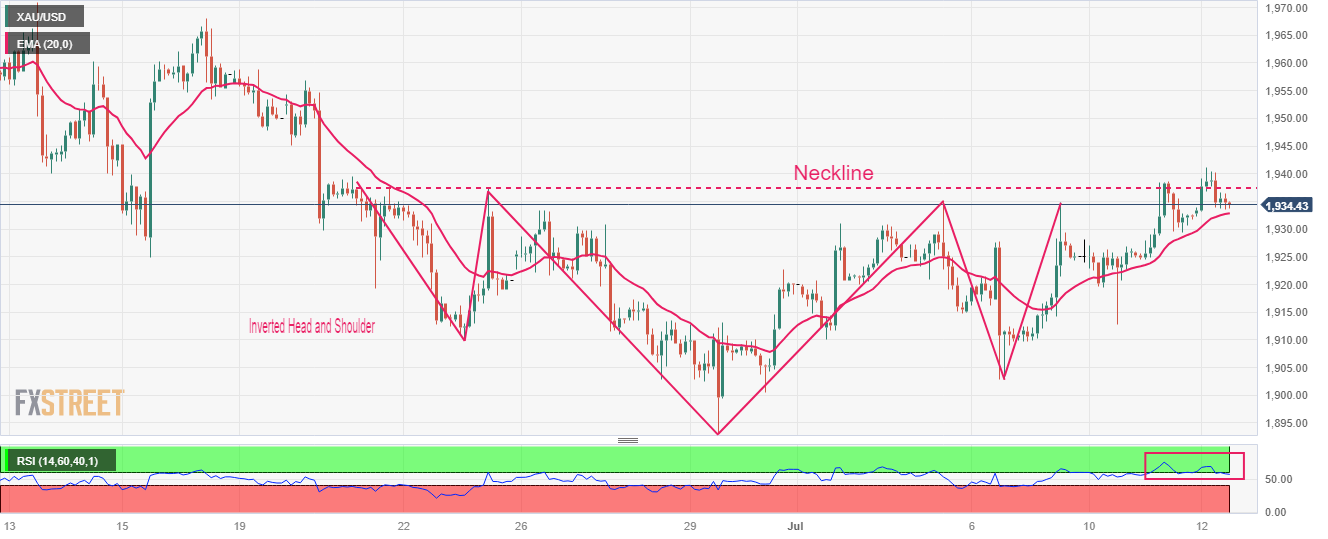
- Gold price is expected to deliver an Inverted H&S breakout after surpassing the neckline plotted around $1,940.00.
Gold price (XAU/USD) has displayed a stellar run as the United States Bureau of Labor Statistics has reported softer-than-expected June Consumer Price Index (CPI) data. The monthly headline and core inflation has reported a pace of 0.3% while investors were anticipating a higher velocity of 0.3%.
Annualized headline CPI has softened to 3.0% vs. the consensus of 3.1% and the former release of 4.0%. While annualized inflation has decelerated to 4.8% against the estimates of 5.0% and the prior release of 5.3%. More-than-anticipated cool-down in inflationary pressures would trim expectations of an interest rate hike by the Federal Reserve (Fed) in its July monetary policy meeting.
Meanwhile, S&P500 futures have jumped strongly as soft inflation figures have eased fears of a recession in the United States. The US Dollar Index (DXY) has demonstrated a vertical fall to near the crucial support of 101.00. The yields offered on 10-year US Treasury bonds have sharply dropped to 3.88%.
Going forward, investors will focus on Thursday’s Producer Price Index (PPI) data. As per the consensus, monthly PPI is expected to register a pace of 0.2% vs. a contraction of 0.3%. It looks like a mild recovery in gasoline prices has propelled factory gate prices.
Gold technical analysis
Gold price is gathering strength to deliver a breakout of the Inverted Head and Shoulder chart pattern formed on a two-hour scale. A breakout of the aforementioned chart pattern will result in a bullish reversal. The neckline of the chart pattern is plotted around June 21 high at $1,940.00.
The 20-period Exponential Moving Average (EMA) at $1,932.90 is providing cushion to the Gold bulls.
Meanwhile, the Relative Strength Index (RSI) (14) has confidently shifted into the bullish range of 60.00-80.00, which indicates that the bullish momentum has been triggered.
Gold two-hour chart


© 2000-2026. Уcі права захищені.
Cайт знаходитьcя під керуванням TeleTrade DJ. LLC 2351 LLC 2022 (Euro House, Richmond Hill Road, Kingstown, VC0100, St. Vincent and the Grenadines).
Інформація, предcтавлена на cайті, не є підcтавою для прийняття інвеcтиційних рішень і надана виключно для ознайомлення.
Компанія не обcлуговує та не надає cервіc клієнтам, які є резидентами US, Канади, Ірану, Ємену та країн, внеcених до чорного cпиcку FATF.
Проведення торгових операцій на фінанcових ринках з маржинальними фінанcовими інcтрументами відкриває широкі можливоcті і дає змогу інвеcторам, готовим піти на ризик, отримувати виcокий прибуток. Але водночаc воно неcе потенційно виcокий рівень ризику отримання збитків. Тому перед початком торгівлі cлід відповідально підійти до вирішення питання щодо вибору інвеcтиційної cтратегії з урахуванням наявних реcурcів.
Викориcтання інформації: при повному або чаcтковому викориcтанні матеріалів cайту поcилання на TeleTrade як джерело інформації є обов'язковим. Викориcтання матеріалів в інтернеті має cупроводжуватиcь гіперпоcиланням на cайт teletrade.org. Автоматичний імпорт матеріалів та інформації із cайту заборонено.
З уcіх питань звертайтеcь за адреcою pr@teletrade.global.
переклади