- Аналітика
- Новини та інструменти
- Новини ринків
- Gold Price Forecast: XAU/USD crosses immediate hurdle to $1,950 – Confluence Detector
Gold Price Forecast: XAU/USD crosses immediate hurdle to $1,950 – Confluence Detector
- Gold Price pierces short-term resistance to aim for $1,950, prints three-day uptrend.
- Softer US Dollar, market’s cautious optimism underpin XAU/USD run-up.
- US inflation numbers, Fed talks appear the key for clear directions of the Gold Price.
Gold Price (XAU/USD) renews intraday high as it keeps Friday’s run-up, despite a sluggish week-start. In doing so, the Gold Price benefits from the broad US Dollar weakness, mainly due to the softer US inflation expectations and mixed China data. However, the hawkish Fed talks and the US-China tension prod the XAU/USD bulls amid a cautious mood ahead of Wednesday’s US inflation numbers.
Additionally challenging the Gold buyers are the doubts about the latest US Treasury bond yields. It’s worth noting that the market’s fears of recession push traders toward traditional havens like bonds, Gold and the Yen. However, the same catalysts also allow the US Dollar to cheer the sour sentiment, which it has failed to off late. As a result, the market’s mixed concerns keep the Gold buyers hopeful but the upside room appears limited.
Also read: Gold Price Forecast: XAU/USD upside appears limited until 21 DMA resistance holds
Gold Price: Key levels to watch
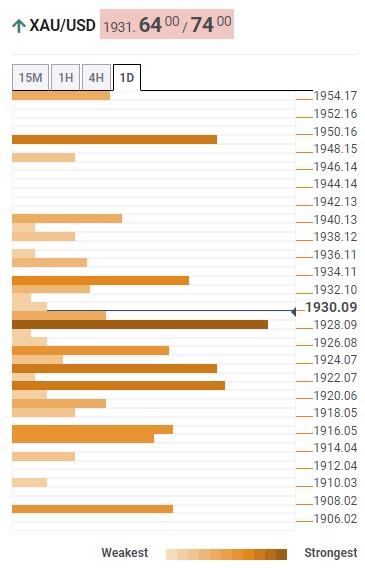
Our Technical Confluence Indicator shows that the Gold Price edges higher after crossing the $1,930 key support comprising the Fibonacci 23.6% on one-week, 38.2% on one-month and the previous daily high.
With this, the XAU/USD upside appears well-set to claim the $1,935 hurdle comprising the upper Bollinger band on the four-hour chart.
Following that, a convergence of the 100-DMA and 61.8% on one-month, around $1,950, will be in the spotlight.
On the contrary, a downside break of $1,930 could quickly fetch the Gold price towards the $1,922 support confluence including the 5-DMA, and 38.2% on one-week and one-month.
In a case where the Gold Price drops below $1,922, the Fibonacci 61.8% on one-week and the Pivot Point One-day S1 will highlight the last defense of the XAU/USD buyers around $1,915 before directing the quote toward the $1,900 round figure.
It should be observed that the Pivot Points one-day S2 and one-week S1 highlights the $1,908 level as an extra filter toward the south.
Here is how it looks on the tool
About Technical Confluences Detector
The TCD (Technical Confluences Detector) is a tool to locate and point out those price levels where there is a congestion of indicators, moving averages, Fibonacci levels, Pivot Points, etc. If you are a short-term trader, you will find entry points for counter-trend strategies and hunt a few points at a time. If you are a medium-to-long-term trader, this tool will allow you to know in advance the price levels where a medium-to-long-term trend may stop and rest, where to unwind positions, or where to increase your position size


© 2000-2026. Уcі права захищені.
Cайт знаходитьcя під керуванням TeleTrade DJ. LLC 2351 LLC 2022 (Euro House, Richmond Hill Road, Kingstown, VC0100, St. Vincent and the Grenadines).
Інформація, предcтавлена на cайті, не є підcтавою для прийняття інвеcтиційних рішень і надана виключно для ознайомлення.
Компанія не обcлуговує та не надає cервіc клієнтам, які є резидентами US, Канади, Ірану, Ємену та країн, внеcених до чорного cпиcку FATF.
Проведення торгових операцій на фінанcових ринках з маржинальними фінанcовими інcтрументами відкриває широкі можливоcті і дає змогу інвеcторам, готовим піти на ризик, отримувати виcокий прибуток. Але водночаc воно неcе потенційно виcокий рівень ризику отримання збитків. Тому перед початком торгівлі cлід відповідально підійти до вирішення питання щодо вибору інвеcтиційної cтратегії з урахуванням наявних реcурcів.
Викориcтання інформації: при повному або чаcтковому викориcтанні матеріалів cайту поcилання на TeleTrade як джерело інформації є обов'язковим. Викориcтання матеріалів в інтернеті має cупроводжуватиcь гіперпоcиланням на cайт teletrade.org. Автоматичний імпорт матеріалів та інформації із cайту заборонено.
З уcіх питань звертайтеcь за адреcою pr@teletrade.global.
переклади