- Аналітика
- Новини та інструменти
- Новини ринків
- USD/CAD Price Analysis: Struggles near multi-day low, seems vulnerable to slide further
USD/CAD Price Analysis: Struggles near multi-day low, seems vulnerable to slide further
- USD/CAD meets with a fresh supply on Tuesday and is weighed down by a combination of factors.
- An uptick in Oil prices underpins the Loonie and exerts some pressure amid sustained USD selling.
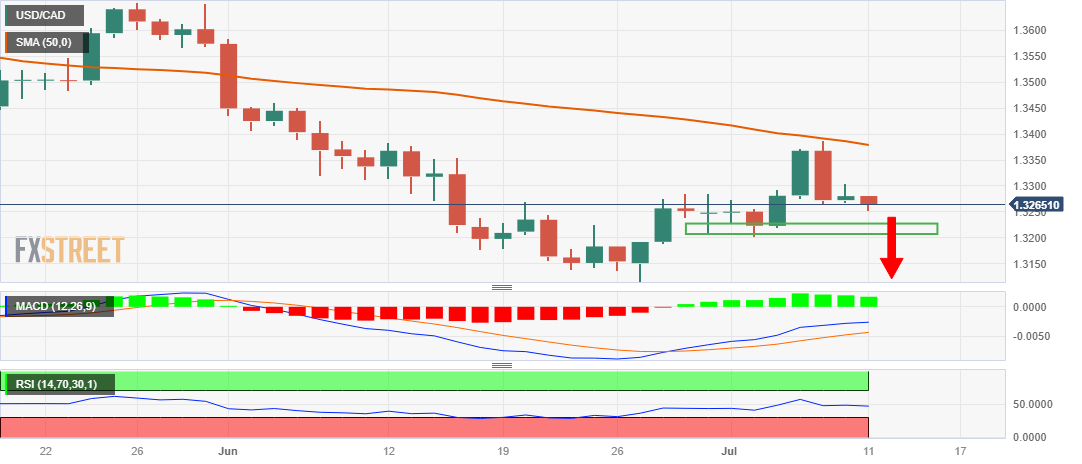
- The recent failure near the 50-day SMA and the subsequent fall support prospects for further losses.
The USD/CAD pair comes under some renewed selling pressure following the previous day's modest bounce and hits a four-day low, around the 1.3250 area during the Asian session on Tuesday.
Crude Oil prices regain some positive traction and reverse a part of Monday's pullback from a five-week high, which, in turn, is seen underpinning the commodity-linked Loonie. The US Dollar (USD), on the other hand, prolongs its descending trend for the fourth straight day and drops to a two-month low. This contributes to the offered tone surrounding the USD/CAD pair and supports prospects for further losses.
From a technical perspective, last week's failure near the 50-day Simple Moving Average (SMA) and the subsequent sharp pullback from the 1.3385 region, or a one-month peak, favour bearish traders. Moreover, oscillators on the daily chart have again started gaining negative traction and add credence to the negative outlook, suggesting that the path of least resistance for the USD/CAD pair is to the downside.
Hence, some follow-through decline towards testing the next relevant support near the 1.3225-1.3220 area, en route to the 1.3200 mark, or the monthly low touched last week, looks like a distinct possibility. A convincing break below the latter could make the USD/CAD pair vulnerable to weaken further below the 1.3145 intermediate support and challenge the YTD low, around the 1.3115 area touched in June.
On the flip side, the overnight swing high, around 1.3300 round figure now seems to act as an immediate hurdle. A sustained move beyond might trigger a short-covering move and lift the USD/CAD pair back towards the 50-day SMA resistance, currently around the 1.3375-1.3380 region. This is closely followed by the 1.3400 mark, which if cleared decisively will shift the near-term bias in favour of bullish traders.
USD/CAD daily chart
Key levels to watch


© 2000-2026. Уcі права захищені.
Cайт знаходитьcя під керуванням TeleTrade DJ. LLC 2351 LLC 2022 (Euro House, Richmond Hill Road, Kingstown, VC0100, St. Vincent and the Grenadines).
Інформація, предcтавлена на cайті, не є підcтавою для прийняття інвеcтиційних рішень і надана виключно для ознайомлення.
Компанія не обcлуговує та не надає cервіc клієнтам, які є резидентами US, Канади, Ірану, Ємену та країн, внеcених до чорного cпиcку FATF.
Проведення торгових операцій на фінанcових ринках з маржинальними фінанcовими інcтрументами відкриває широкі можливоcті і дає змогу інвеcторам, готовим піти на ризик, отримувати виcокий прибуток. Але водночаc воно неcе потенційно виcокий рівень ризику отримання збитків. Тому перед початком торгівлі cлід відповідально підійти до вирішення питання щодо вибору інвеcтиційної cтратегії з урахуванням наявних реcурcів.
Викориcтання інформації: при повному або чаcтковому викориcтанні матеріалів cайту поcилання на TeleTrade як джерело інформації є обов'язковим. Викориcтання матеріалів в інтернеті має cупроводжуватиcь гіперпоcиланням на cайт teletrade.org. Автоматичний імпорт матеріалів та інформації із cайту заборонено.
З уcіх питань звертайтеcь за адреcою pr@teletrade.global.
переклади