- Аналітика
- Новини та інструменти
- Новини ринків
- Gold Price Forecast: XAU/USD juggles above $1,920 as focus shifts to US Inflation
Gold Price Forecast: XAU/USD juggles above $1,920 as focus shifts to US Inflation
- Gold price is consolidating above $1,920.00 ahead of US inflation data.
- The overall risk profile is still negative as the Fed is going to resume its policy-tightening spell.
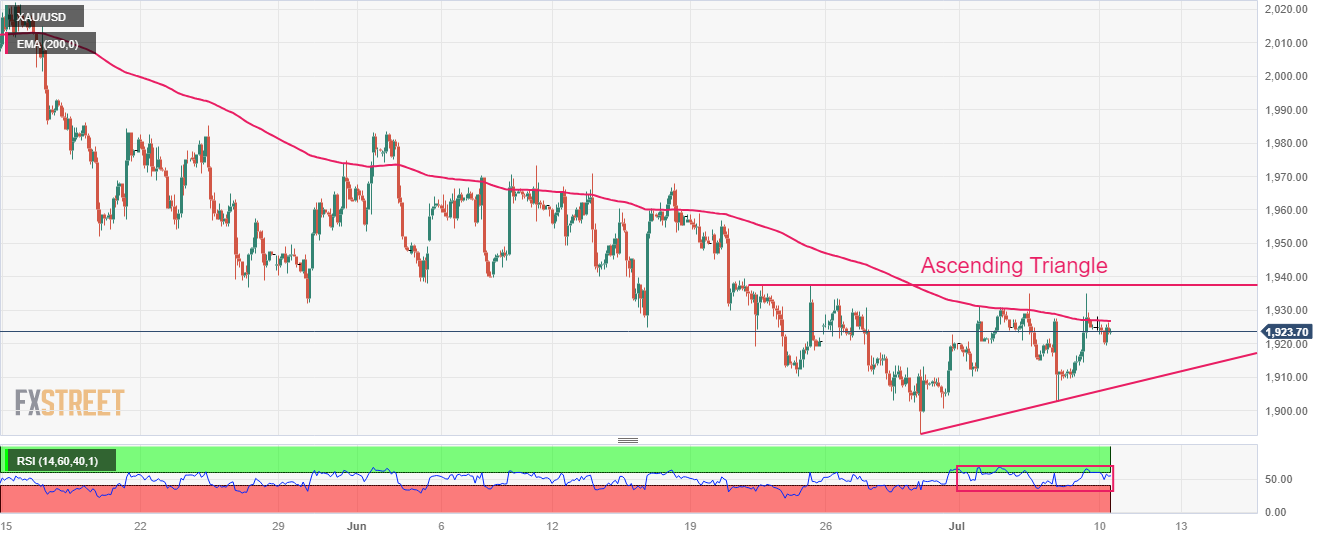
- Gold price is auctioning in an Ascending Triangle chart pattern.
Gold price (XAU/USD) is demonstrating a non-directional performance after correcting from a weekly high of $1,935.00 in the London session. The precious metal has turned topsy-turvy as investors are shifting their focus towards the United States Consumer Price Index (CPI) after the impact of the Nonfarm Payrolls (NFP) report.
Analysts at Well Fargo expect a surprisingly resilient labor market has helped to keep the United States economy expanding at a moderate pace despite continued fears about a recession. However, even amid more forthcoming labor supply and gradually cooling labor demand, the weight of the evidence still suggests that the labor market remains too tight to be consistent with 2% inflation.
Meanwhile, S&P500 futures have recovered decent losses generated in early Europe, portraying a recovery in the risk appetite of the market participants. The overall risk profile is still negative as the Federal Reserve (Fed) is going to resume its policy-tightening spell and will push interest rates to 5.25-5.50%. Investors should note that Fed chair Jerome Powell skipped the rate-hiking spree in its June monetary policy meeting.
The US Dollar Index (DXY) has rebounded after dropping to near 102.30. A sideways auction is expected in the USD Index ahead of US inflation data. As per the consensus, monthly headline CPI elevated at a higher pace of 0.3% vs. the prior pace of 0.1%. Annualized headline inflation is expected to soften to 3.1% against the former release of 4.0%. Declining gasoline prices have decelerated headline inflation, however, the major focus will be on the core inflation data.
Gold technical analysis
Gold price is auctioning in an Ascending Triangle chart pattern on a two-hour scale. Upward-sloping trendline of the aforementioned chart pattern is plotted from June 29 low at $1,893.00 while the horizontal resistance is placed from June 21 high around $1,937.00.
The 200-period Exponential Moving Average (EMA) at $1,927.00 is acting as a barricade for the Gold bulls.
A 40.00-60.00 range oscillation by the Relative Strength Index (RSI) (14) indicates a non-directional performance.
Gold two-hour chart


© 2000-2026. Уcі права захищені.
Cайт знаходитьcя під керуванням TeleTrade DJ. LLC 2351 LLC 2022 (Euro House, Richmond Hill Road, Kingstown, VC0100, St. Vincent and the Grenadines).
Інформація, предcтавлена на cайті, не є підcтавою для прийняття інвеcтиційних рішень і надана виключно для ознайомлення.
Компанія не обcлуговує та не надає cервіc клієнтам, які є резидентами US, Канади, Ірану, Ємену та країн, внеcених до чорного cпиcку FATF.
Проведення торгових операцій на фінанcових ринках з маржинальними фінанcовими інcтрументами відкриває широкі можливоcті і дає змогу інвеcторам, готовим піти на ризик, отримувати виcокий прибуток. Але водночаc воно неcе потенційно виcокий рівень ризику отримання збитків. Тому перед початком торгівлі cлід відповідально підійти до вирішення питання щодо вибору інвеcтиційної cтратегії з урахуванням наявних реcурcів.
Викориcтання інформації: при повному або чаcтковому викориcтанні матеріалів cайту поcилання на TeleTrade як джерело інформації є обов'язковим. Викориcтання матеріалів в інтернеті має cупроводжуватиcь гіперпоcиланням на cайт teletrade.org. Автоматичний імпорт матеріалів та інформації із cайту заборонено.
З уcіх питань звертайтеcь за адреcою pr@teletrade.global.
переклади