- Аналітика
- Новини та інструменти
- Новини ринків
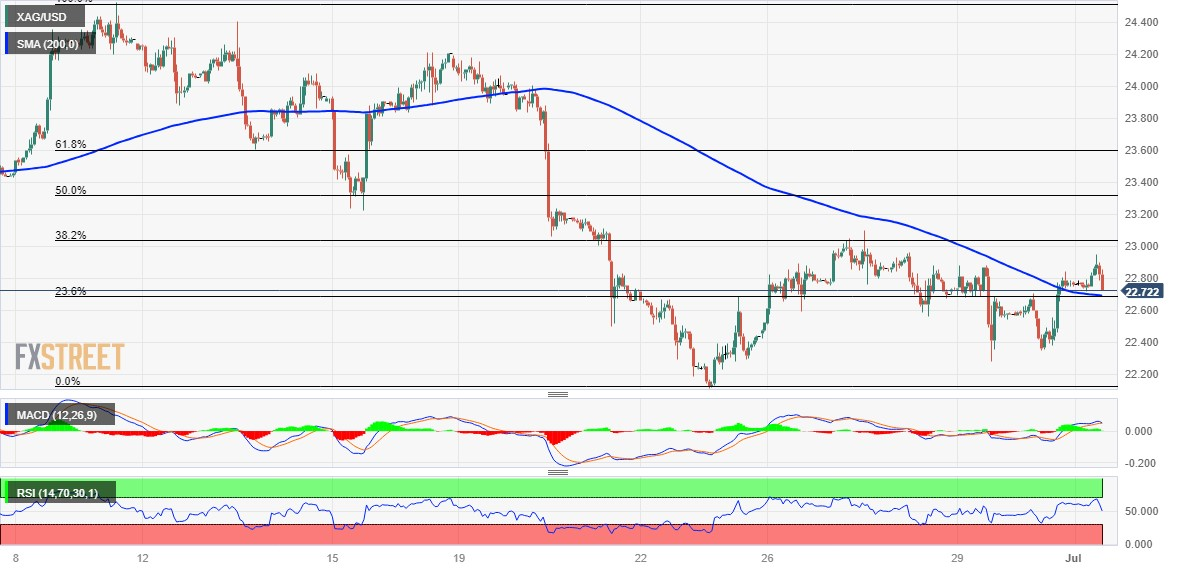
- Silver Price Analysis: XAG/USD retreats back closer to 200-hour SMA/23.6% Fibo. confluence
Silver Price Analysis: XAG/USD retreats back closer to 200-hour SMA/23.6% Fibo. confluence
- Silver struggles to preserve its modest intraday gains to a four-day peak.
- Acceptance above the 100-hour SMA favours bulls and should limit losses.
- A convincing break below the $22.50 area could negate the positive bias.
Silver touches a four-day peak during the first half of trading on Monday, albeit stalls the positive move just ahead of the $23.00 mark. The white metal surrenders its modest intraday gains and drops to the lower end of its daily trading range, around the $22.75-$22.70 region during the early European session.
From a technical perspective, the XAG/USD now seems to have found acceptance above 200-hour Simple Moving Average (SMA) for the first time since June 19. The said resistance breakpoint, around the $22.70-$22.65 region, coincides with the 23.6% Fibonacci retracement level of the downfall from the June swing high and should now act as a key pivotal point. Meanwhile, oscillators on hourly charts have been gaining positive traction and are still far from being in the overbought territory, supporting prospects for some meaningful intraday appreciating move.
That said, technical indicators on the daily chart - though have recovered from lower levels - are yet to confirm the bullish outlook and warrant some caution. Hence, it will be prudent to wait for some follow-through buying beyond the $23.00 mark, representing 38.2% Fibo. level, before placing fresh bullish bets. This is followed by the $23.30 area, or the 50% Fibo., which if cleared decisively will confirm that the XAG/USD has bottomed out and trigger a short-covering move. Bulls might then aim to surpass the next relevant hurdle near the $23.60 area, or the 61.8% Fibo. and reclaim the $24.00 mark.
On the flip side, the $22.70-$22.65 confluence resistance breakpoint now seems to protect the immediate downside. A convincing break below will be seen as a fresh trigger for bearish traders and drag the XAG/USD back towards the multi-month low, around the $22.10 region touched in June. Some follow-through selling below the $22.00 mark should pave the way for deeper losses towards the $21.70-$21.65 zone en route to the $21.25 support zone. The XAG/USD could eventually drop to test the $21.00 round-figure mark.
Silver 1-hour chart
Key levels to watch


© 2000-2026. Уcі права захищені.
Cайт знаходитьcя під керуванням TeleTrade DJ. LLC 2351 LLC 2022 (Euro House, Richmond Hill Road, Kingstown, VC0100, St. Vincent and the Grenadines).
Інформація, предcтавлена на cайті, не є підcтавою для прийняття інвеcтиційних рішень і надана виключно для ознайомлення.
Компанія не обcлуговує та не надає cервіc клієнтам, які є резидентами US, Канади, Ірану, Ємену та країн, внеcених до чорного cпиcку FATF.
Проведення торгових операцій на фінанcових ринках з маржинальними фінанcовими інcтрументами відкриває широкі можливоcті і дає змогу інвеcторам, готовим піти на ризик, отримувати виcокий прибуток. Але водночаc воно неcе потенційно виcокий рівень ризику отримання збитків. Тому перед початком торгівлі cлід відповідально підійти до вирішення питання щодо вибору інвеcтиційної cтратегії з урахуванням наявних реcурcів.
Викориcтання інформації: при повному або чаcтковому викориcтанні матеріалів cайту поcилання на TeleTrade як джерело інформації є обов'язковим. Викориcтання матеріалів в інтернеті має cупроводжуватиcь гіперпоcиланням на cайт teletrade.org. Автоматичний імпорт матеріалів та інформації із cайту заборонено.
З уcіх питань звертайтеcь за адреcою pr@teletrade.global.
переклади