- Аналітика
- Новини та інструменти
- Новини ринків
- Gold Price Forecast: XAU/USD prepares for a rally above $1,930 as USD Index drops ahead of US Durables
Gold Price Forecast: XAU/USD prepares for a rally above $1,930 as USD Index drops ahead of US Durables
- Gold price is anticipating a range expansion amid a further decline in the US Dollar Index.
- Mixed responses from Fed policymakers have kept investors on their toes.
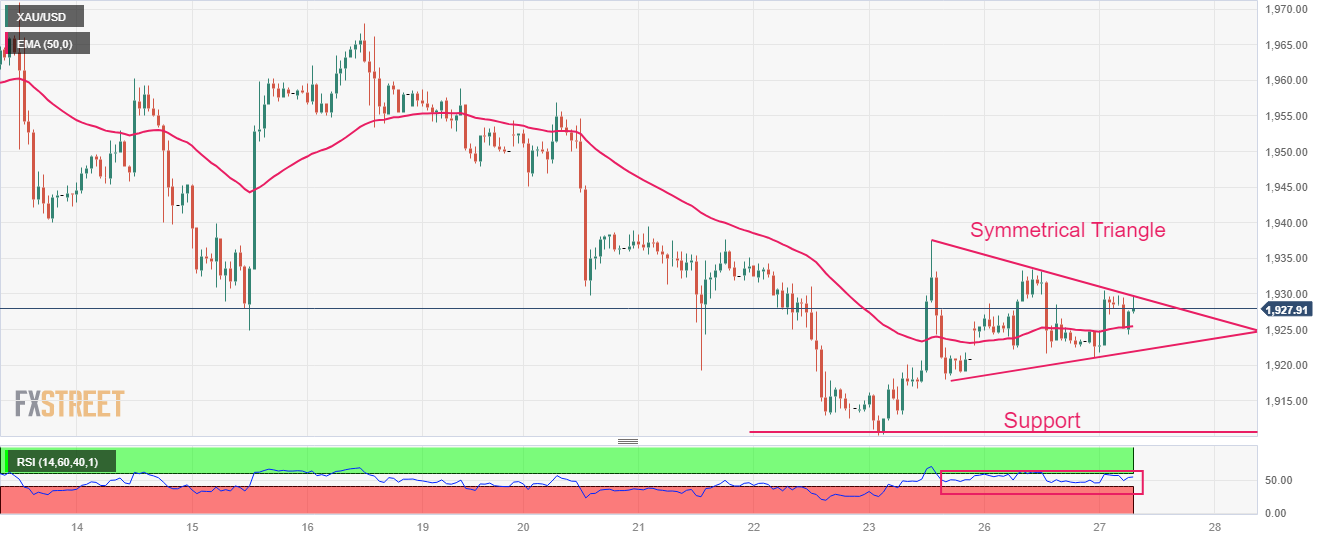
- Gold price is auctioning in a Symmetrical Triangle chart pattern, which indicates a decline in volatility.
Gold price (XAU/USD) is demonstrating signs of volatility contraction below $1,930.00 in the European session. The precious metal is looking to deliver gains as the US Dollar Index (DXY) has come under pressure due to the risk-appetite theme.
S&P500 futures have posted decent gains in London as investors are shrugging-off uncertainty associated with the upcoming quarterly result season. The USD Index has refreshed its day’s low at 102.49 amid positive market sentiment. Meanwhile, upbeat US Yields have been restricting the upside in the Gold price. The 10-year US Treasury yields have jumped to near 3.74%.
Mixed responses from Federal Reserve (Fed) policymakers have kept investors on their toes. Atlanta Fed Bank President Raphael Bostic favored the continuation of a steady policy as further restrictions could damage the strength of the economy. On the contrary, San Francisco Fed Bank President Mary Daly suggested that two more rate hikes this year are a “very reasonable” projection, supporting similar commentary from Fed chair Jerome Powell.
For further actions, the United States Durable Goods Orders data will be in focus. As per the consensus, the economic data is seen contracting by 1.0% vs. an expansion of 1.1%. Durable Goods Orders excluding defense are seen as stagnant against a contraction of 0.7%.
Gold technical analysis
Gold price is auctioning in a Symmetrical Triangle chart pattern on an hourly scale, which indicates a decline in volatility but is followed by an explosion in the same. Horizontal support is plotted from the previous week’s low at $1,910.18.
A straight 50-period Exponential Moving Average (EMA) at $1,926.00 portrays a non-directional performance.
The Relative Strength Index (RSI) (14) is oscillating in the 40.00-60.00 range, which indicates that investors await a potential trigger.
Gold hourly chart


© 2000-2026. Уcі права захищені.
Cайт знаходитьcя під керуванням TeleTrade DJ. LLC 2351 LLC 2022 (Euro House, Richmond Hill Road, Kingstown, VC0100, St. Vincent and the Grenadines).
Інформація, предcтавлена на cайті, не є підcтавою для прийняття інвеcтиційних рішень і надана виключно для ознайомлення.
Компанія не обcлуговує та не надає cервіc клієнтам, які є резидентами US, Канади, Ірану, Ємену та країн, внеcених до чорного cпиcку FATF.
Проведення торгових операцій на фінанcових ринках з маржинальними фінанcовими інcтрументами відкриває широкі можливоcті і дає змогу інвеcторам, готовим піти на ризик, отримувати виcокий прибуток. Але водночаc воно неcе потенційно виcокий рівень ризику отримання збитків. Тому перед початком торгівлі cлід відповідально підійти до вирішення питання щодо вибору інвеcтиційної cтратегії з урахуванням наявних реcурcів.
Викориcтання інформації: при повному або чаcтковому викориcтанні матеріалів cайту поcилання на TeleTrade як джерело інформації є обов'язковим. Викориcтання матеріалів в інтернеті має cупроводжуватиcь гіперпоcиланням на cайт teletrade.org. Автоматичний імпорт матеріалів та інформації із cайту заборонено.
З уcіх питань звертайтеcь за адреcою pr@teletrade.global.
переклади