- Аналітика
- Новини та інструменти
- Новини ринків
- Gold Price Forecast: XAU/USD retreats as USD Index prints a fresh day high, US PMI eyed
Gold Price Forecast: XAU/USD retreats as USD Index prints a fresh day high, US PMI eyed
- Gold price has retreated amid sheer strength in the US Dollar Index.
- US Manufacturing PMI is expected to register contraction consecutively for the eighth time.
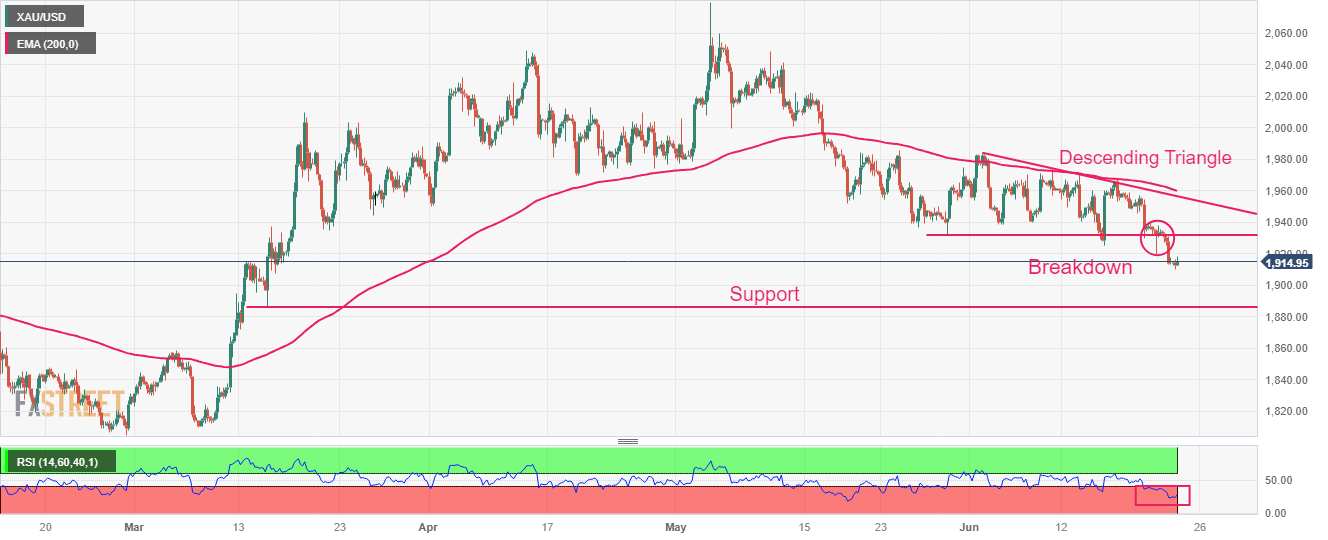
- Gold price has demonstrated a sheer fall after a breakdown of the Descending Triangle.
Gold price (XAU/USD) has witnessed selling pressure around $1,917.50 in the European session. The short-lived pullback in the precious metal has concluded and it is expected to drop back to an intraday low at $1,910.00. A sell-off move in the yellow metal was triggered due to the upbeat US Dollar Index (DXY).
S&P500 futures have carry-forwarded significant losses generated in Asia to Europe as the market mood is quite risk-off. Global growth prospects are under threat as the continuation of the policy-tightening regime by central banks has propelled fears of recession.
The US Dollar Index has stretched its rally to 102.70 as the bleak global outlook has improved its appeal. Meanwhile, fears of more interest rate hikes from the Federal Reserve (Fed) are also keeping the US Dollar in the upside trajectory. Contrary to the strength in the USD Index, US Treasury yields are facing pressure. The 10-year US Treasury yields have dropped to near 3.78%.
Going forward, the release of the preliminary S&P Global PMI data (June) will be keenly watched. A per the prior estimation report, Manufacturing PMI will show a mild increase to 48.5 vs. the prior release of 48.4. Services PMI is seen declining to 54.0 against the former release of 54.9.
Investors should note that US Manufacturing PMI has been contracting consecutively for seven months and further contraction would impact the US Dollar. A figure below 50.0 is considered a contraction in economic activities.
Gold technical analysis
Gold price has demonstrated a sheer fall after a breakdown of the Descending Triangle, which is a volatility contraction chart pattern, formed on a four-hour scale. A breakdown of the aforementioned chart pattern is followed by wider ticks and heavy volume. Later, the asset is expected to find support near $1,886.00.
The precious metal is trading below the 200-period Exponential Moving Average (EMA) at $1,960.00, which indicates that the long-term trend is bearish.
The Relative Strength Index (RSI) (14) is oscillating in the bearish range of 20.00-40.00, which indicates that the downside momentum has been triggered.
Gold four-hour chart


© 2000-2026. Уcі права захищені.
Cайт знаходитьcя під керуванням TeleTrade DJ. LLC 2351 LLC 2022 (Euro House, Richmond Hill Road, Kingstown, VC0100, St. Vincent and the Grenadines).
Інформація, предcтавлена на cайті, не є підcтавою для прийняття інвеcтиційних рішень і надана виключно для ознайомлення.
Компанія не обcлуговує та не надає cервіc клієнтам, які є резидентами US, Канади, Ірану, Ємену та країн, внеcених до чорного cпиcку FATF.
Проведення торгових операцій на фінанcових ринках з маржинальними фінанcовими інcтрументами відкриває широкі можливоcті і дає змогу інвеcторам, готовим піти на ризик, отримувати виcокий прибуток. Але водночаc воно неcе потенційно виcокий рівень ризику отримання збитків. Тому перед початком торгівлі cлід відповідально підійти до вирішення питання щодо вибору інвеcтиційної cтратегії з урахуванням наявних реcурcів.
Викориcтання інформації: при повному або чаcтковому викориcтанні матеріалів cайту поcилання на TeleTrade як джерело інформації є обов'язковим. Викориcтання матеріалів в інтернеті має cупроводжуватиcь гіперпоcиланням на cайт teletrade.org. Автоматичний імпорт матеріалів та інформації із cайту заборонено.
З уcіх питань звертайтеcь за адреcою pr@teletrade.global.
переклади