- Аналітика
- Новини та інструменти
- Новини ринків
- Gold Price Forecast: XAU/USD retreats from $1,930 as US jobless claims remain slightly above consensus
Gold Price Forecast: XAU/USD retreats from $1,930 as US jobless claims remain slightly above consensus
- Gold price has shown a V-shape sell-off around $1,930.00 amid a recovery in the USD Index.
- US weekly jobless claims have landed at 264K, similar to their prior release but higher than expectations of 260K.
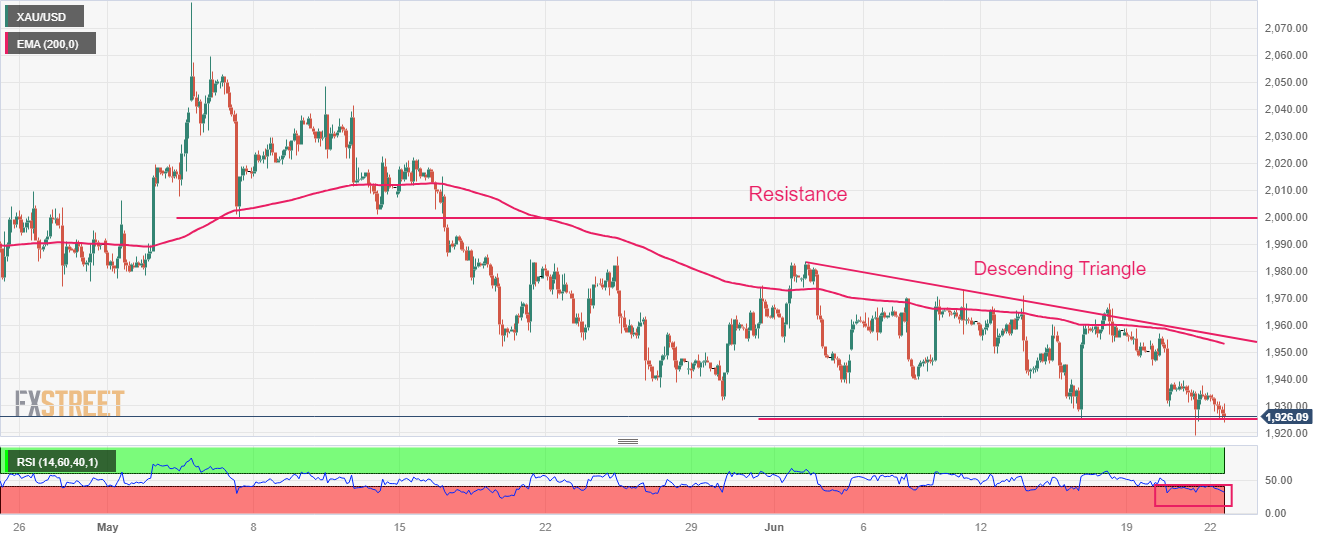
- Gold price is looking to deliver a break below the Descending Triangle chart pattern.
Gold price (XAU/USD) has retreated after a solid recovery to near $1,930.00 in the early New York session. The precious metal has faced selling pressure despite the weekly jobless claims for the week ending June 16 have landed marginally higher than expectations. The US Department of Labor has reported that first-time jobless claims were 264K, similar to their prior release while the street was anticipating a figure of 260K.
S&P500 futures have recovered some losses, however, a weak opening is broadly expected. Investors have underpinned the risk-aversion theme as more rate hikes by the Federal Reserve (Fed) could accelerate fears of a recession in the United States.
Jobless claims have remained higher than expectations straight for the fourth time in a row. Higher jobless claims indicate that labor market conditions are critically losing their appeal. Easing US labor market conditions could propel the chances of only one interest rate hike by year-end.
The US Dollar Index (DXY) has rebounded to near day’s high around 102.16 as investors are providing more value to hawkish testimony by Fed chair Jerome Powell against dovish commentary by Atlanta Fed President Raphael Bostic and Chicago Fed Bank President Austan Goolsbee. The 10-year US Treasury yields have climbed above 3.75%.
Gold technical analysis
Gold price is looking to deliver a break below the Descending Triangle chart pattern formed on a two-hour scale. The downward-sloping trendline of the aforementioned chart pattern is plotted from June 02 high at $1,983.00 while the horizontal support is placed from May 30 low at $1,932.12. The 200-period Exponential Moving Average (EMA) at $1,953.62 is acting as a barricade for the Gold bulls. Horizontal resistance is plotted from May 05 low around $2,000.00.
The Relative Strength Index (RSI) (14) is oscillating in the bearish range of 20.00-40.00, which indicates that the downside momentum has been triggered.
Gold two-hour chart


© 2000-2026. Уcі права захищені.
Cайт знаходитьcя під керуванням TeleTrade DJ. LLC 2351 LLC 2022 (Euro House, Richmond Hill Road, Kingstown, VC0100, St. Vincent and the Grenadines).
Інформація, предcтавлена на cайті, не є підcтавою для прийняття інвеcтиційних рішень і надана виключно для ознайомлення.
Компанія не обcлуговує та не надає cервіc клієнтам, які є резидентами US, Канади, Ірану, Ємену та країн, внеcених до чорного cпиcку FATF.
Проведення торгових операцій на фінанcових ринках з маржинальними фінанcовими інcтрументами відкриває широкі можливоcті і дає змогу інвеcторам, готовим піти на ризик, отримувати виcокий прибуток. Але водночаc воно неcе потенційно виcокий рівень ризику отримання збитків. Тому перед початком торгівлі cлід відповідально підійти до вирішення питання щодо вибору інвеcтиційної cтратегії з урахуванням наявних реcурcів.
Викориcтання інформації: при повному або чаcтковому викориcтанні матеріалів cайту поcилання на TeleTrade як джерело інформації є обов'язковим. Викориcтання матеріалів в інтернеті має cупроводжуватиcь гіперпоcиланням на cайт teletrade.org. Автоматичний імпорт матеріалів та інформації із cайту заборонено.
З уcіх питань звертайтеcь за адреcою pr@teletrade.global.
переклади