- Аналітика
- Новини та інструменти
- Новини ринків
- Gold Price Forecast: XAU/USD seesaws around $1,930 due to hawkish Fed Powell vs. dovish Bostic
Gold Price Forecast: XAU/USD seesaws around $1,930 due to hawkish Fed Powell vs. dovish Bostic
- Gold price has turned topsy-turvy around $1,930.00 as investors get baffled about further interest rate policy by the Fed.
- Mixed commentary from Fed policymakers has kept investors on their toes.
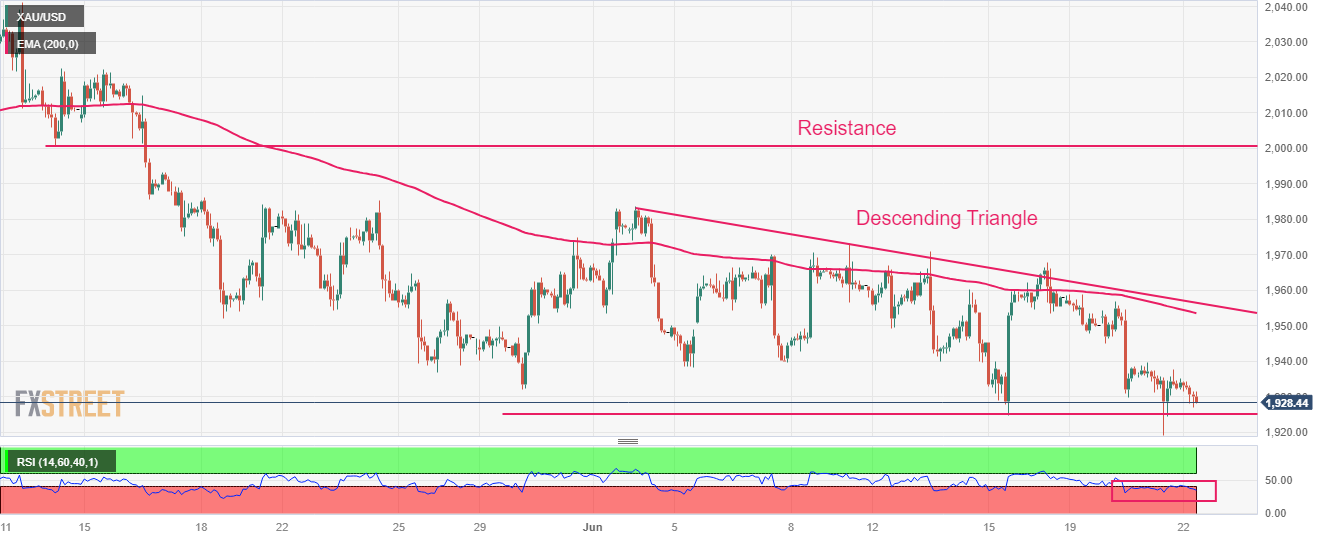
- Gold price is consistently defending the horizontal support of the Descending Triangle chart pattern.
Gold price (XAU/USD) is demonstrating topsy-turvy moves around $1,930.00 in the European session. The precious metal is displaying a non-directional performance as investors have been baffled while assessing hawkish Federal Reserve (Fed) chair Jerome Powell’s hawkish testimony and dovish commentary from Atlanta Fed President Raphael Bostic.
S&P500 futures are showing significant losses in Europe as investors are getting anxious. Caution in the United States market is deepening as the quarterly result season is going to kick off sooner. Technology stocks witnessed extreme pressure as investors are hoping the giant tech-savvy stocks would continue to provide weak guidance due to higher interest rates from the Fed.
The US Dollar Index (DXY) has retreated after a less-confident recovery move to near 102.16 as the impact of dovish commentary from Fed Bostic and Chicago Fed Bank President Austan Goolsbee has faded the impact of Jerome Powell’s hawkish testimony. Contrary to USD Index, the Treasury yields have rebounded sharply. The 10-year US Treasury Yields have jumped to near 3.75%.
Fed Bostic cited that the central bank should not raise interest rates further or it would risk "needlessly" sapping the strength of the economy. While Chicago Fed Bank President Austan Goolsbee favored allowing current interest rates required time to show their impact on the economy.
Gold technical analysis
Gold price is consistently defending the horizontal support of the Descending Triangle chart pattern formed on a two-hour scale, which is placed from May 30 low at $1,932.12. The downward-sloping trendline of the aforementioned chart pattern is plotted from June 02 high at $1,983.00. The 200-period Exponential Moving Average (EMA) at $1,953.62 is acting as a barricade for the Gold bulls. Horizontal resistance is plotted from May 05 low around $2,000.00.
The Relative Strength Index (RSI) (14) is oscillating in the bearish range of 20.00-40.00, which indicates that the downside momentum has been triggered.
Gold two-hour chart


© 2000-2026. Уcі права захищені.
Cайт знаходитьcя під керуванням TeleTrade DJ. LLC 2351 LLC 2022 (Euro House, Richmond Hill Road, Kingstown, VC0100, St. Vincent and the Grenadines).
Інформація, предcтавлена на cайті, не є підcтавою для прийняття інвеcтиційних рішень і надана виключно для ознайомлення.
Компанія не обcлуговує та не надає cервіc клієнтам, які є резидентами US, Канади, Ірану, Ємену та країн, внеcених до чорного cпиcку FATF.
Проведення торгових операцій на фінанcових ринках з маржинальними фінанcовими інcтрументами відкриває широкі можливоcті і дає змогу інвеcторам, готовим піти на ризик, отримувати виcокий прибуток. Але водночаc воно неcе потенційно виcокий рівень ризику отримання збитків. Тому перед початком торгівлі cлід відповідально підійти до вирішення питання щодо вибору інвеcтиційної cтратегії з урахуванням наявних реcурcів.
Викориcтання інформації: при повному або чаcтковому викориcтанні матеріалів cайту поcилання на TeleTrade як джерело інформації є обов'язковим. Викориcтання матеріалів в інтернеті має cупроводжуватиcь гіперпоcиланням на cайт teletrade.org. Автоматичний імпорт матеріалів та інформації із cайту заборонено.
З уcіх питань звертайтеcь за адреcою pr@teletrade.global.
переклади