- Аналітика
- Новини та інструменти
- Новини ринків
- Silver Price Analysis: XAG/USD plummets to a two-month low, below the 200-day EMA
Silver Price Analysis: XAG/USD plummets to a two-month low, below the 200-day EMA
- XAG/USD sinks below key $22.96, the 200-day EMA level.
- Bearish RSI and RoC indicate a strong sell-off, warranting further XAG/USD downside.
- XAG/USD upside resistance was found at a $23.00 handle, followed by a challenge of the 100-day EMA.
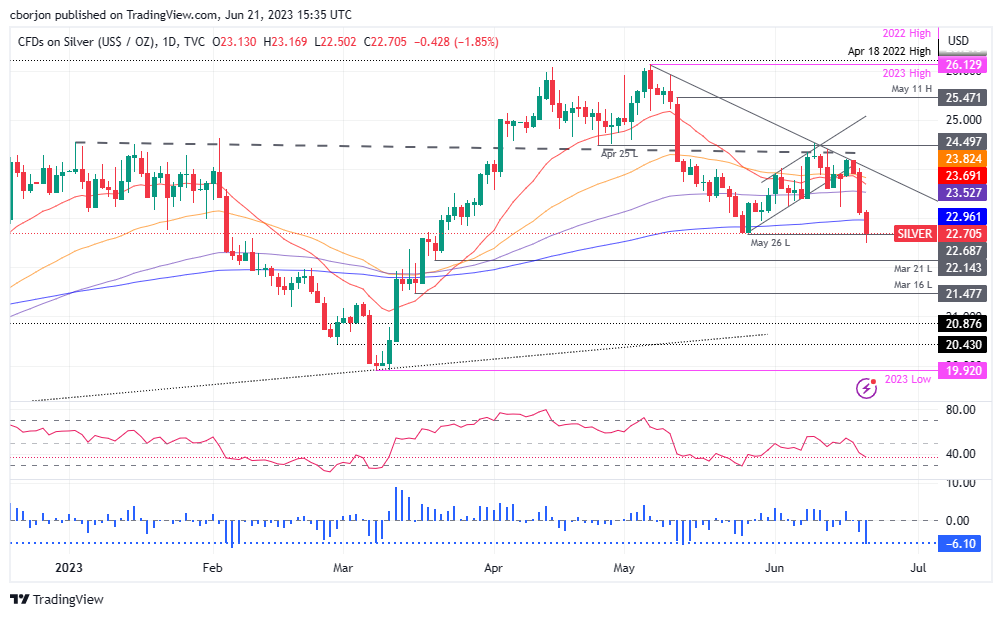
Silver price pierces below the 200-day Exponential Moving Average (EMA) of $22.96 as sellers pile in, dragging prices towards a new two-month low of $22.50, as high US Treasury bond yields pressure the precious metals segment. At the time of writing, XAG/USD trades at $22.75, while Gold (XAU/USD) spot exchanges hands at $1931.02, down 1.64% and 0.23%, respectively.
Risk-off sentiment is weighing on the precious metals segment. Investors remain uncertain as the Fed Chair Jerome Powell commences his two-day testimony at the US Congress, which you can follow here. The US 10-year Treasury note yields 3.775% and gains 4.6 bps, while US real yields, directly influencing XAG/USD’s prices, climb five bps to 1.555%.
XAG/USD Price Analysis: Technical outlook
The XAG/USD remains neutral to downward biased, though it could shift to the downside if XAG/USD prints a daily close below the May 25 swing low of $22.68. That would mean the Silver price breaking the 200-day Exponential Moving Average (EMA) threshold and, from a technical perspective, turning XAG/USD bearish.
Further cementing XAG/USD bearish case is the Relative Strength Index (RSI) indicator at negative territory, while the three-day Rate of Change (RoC) continues to plunge as sellers gain momentum.
That said, in that outcome, XAG/USD could dive towards the March 21 daily low at $22.14 before challenging the $22.00 figure. A breach of the latter will expose the March 16 low at $21.47, followed by the $21.00 mark.
Conversely, if XAG/USD reclaims the 200-day EMA, that could expose the $23.00 handle on the upside, followed by the 100-day EMA at $23.52.
XAG/USD Price Action – Daily chart


© 2000-2026. Уcі права захищені.
Cайт знаходитьcя під керуванням TeleTrade DJ. LLC 2351 LLC 2022 (Euro House, Richmond Hill Road, Kingstown, VC0100, St. Vincent and the Grenadines).
Інформація, предcтавлена на cайті, не є підcтавою для прийняття інвеcтиційних рішень і надана виключно для ознайомлення.
Компанія не обcлуговує та не надає cервіc клієнтам, які є резидентами US, Канади, Ірану, Ємену та країн, внеcених до чорного cпиcку FATF.
Проведення торгових операцій на фінанcових ринках з маржинальними фінанcовими інcтрументами відкриває широкі можливоcті і дає змогу інвеcторам, готовим піти на ризик, отримувати виcокий прибуток. Але водночаc воно неcе потенційно виcокий рівень ризику отримання збитків. Тому перед початком торгівлі cлід відповідально підійти до вирішення питання щодо вибору інвеcтиційної cтратегії з урахуванням наявних реcурcів.
Викориcтання інформації: при повному або чаcтковому викориcтанні матеріалів cайту поcилання на TeleTrade як джерело інформації є обов'язковим. Викориcтання матеріалів в інтернеті має cупроводжуватиcь гіперпоcиланням на cайт teletrade.org. Автоматичний імпорт матеріалів та інформації із cайту заборонено.
З уcіх питань звертайтеcь за адреcою pr@teletrade.global.
переклади