- Аналітика
- Новини та інструменти
- Новини ринків
- Gold Price Forecast: XAU/USD shows volatile spikes around $1,930 despite Fed sticking to hawkish guidance
Gold Price Forecast: XAU/USD shows volatile spikes around $1,930 despite Fed sticking to hawkish guidance
- Gold price is showing volatile spikes around $1,930.00 amid Fed Powell's testimony at Congress.
- Fed Powell has confirmed that policymakers are in favor of further interest rate hikes this year.
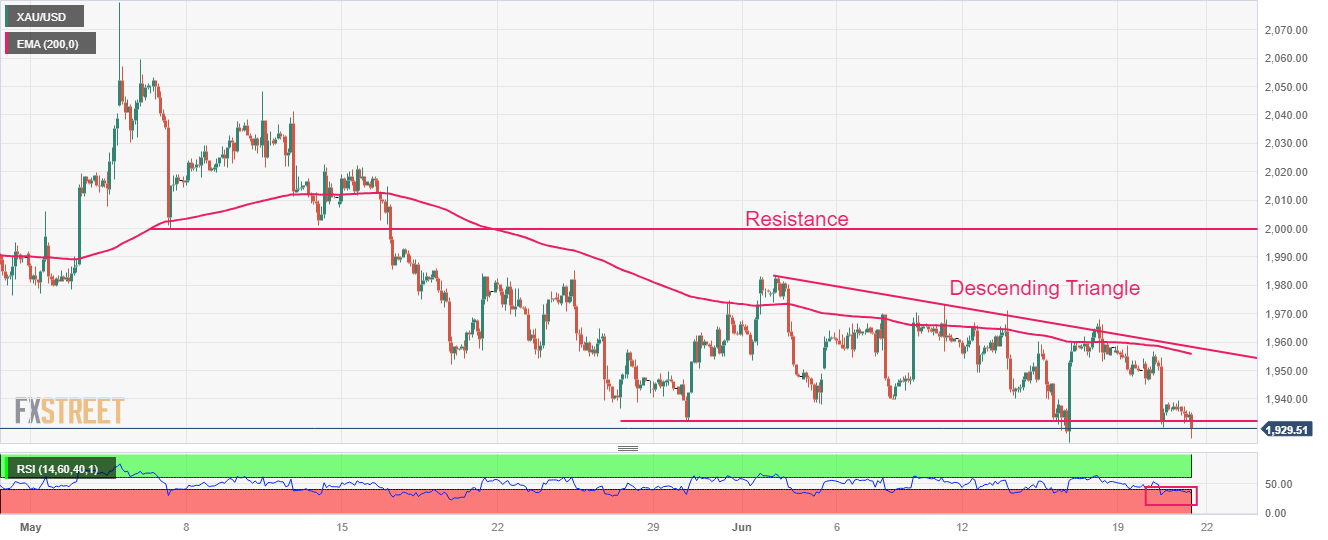
- Gold price is on the edge of the horizontal support of the Descending Triangle chart pattern.
Gold price (XAU/USD) is showing extremely volatile action around $1,930.00 as Federal Reserve (Fed) chair Jerome Powell has sounded hawkish while delivering testimony in front of Congress. The precious metal is strongly defending the $1,930.00 despite Fed Powell having confirmed more rate hikes this year.
S&P500 futures have extended losses further as investors are hoping that expectations of more interest rate hikes from the Federal Reserve (Fed) have pushed the United States economy toward recession. The US Dollar Index (DXY) is showing volatile spikes but is still inside the woods around 102.60. The 10-year US Treasury yields seem choppy around 3.75%.
Fed Powell has confirmed that policymakers are in favor of further interest rate hikes this year as the process of getting inflation back down to 2% has a long way to go. The Fed believes that tight credit conditions are expected to put pressure on economic activities, inflation, and labor market conditions, however, the extent remains uncertain.
Chances of a recession in the United States economy are well solid as more interest rates by the Fed would impact the scales of manufacturing and service activities significantly.
Jerome Powell has confirmed that the central bank will be data-dependent and long-term consumer inflation expectations are well-anchored.
Gold technical analysis
Gold price is on the edge of the horizontal support of the Descending Triangle chart pattern formed on a two-hour scale, which is placed from May 30 low at $1,932.12. The downward-sloping trendline of the aforementioned chart pattern is plotted from June 02 high at $1,983.00. The 200-period Exponential Moving Average (EMA) at $1,958.84 is acting as a barricade for the Gold bulls. Horizontal resistance is plotted from May 05 low around $2,000.00.
The Relative Strength Index (RSI) (14) has slipped into the bearish range of 20.00-40.00, which indicates that the downside momentum has been triggered.
Gold two-hour chart


© 2000-2026. Уcі права захищені.
Cайт знаходитьcя під керуванням TeleTrade DJ. LLC 2351 LLC 2022 (Euro House, Richmond Hill Road, Kingstown, VC0100, St. Vincent and the Grenadines).
Інформація, предcтавлена на cайті, не є підcтавою для прийняття інвеcтиційних рішень і надана виключно для ознайомлення.
Компанія не обcлуговує та не надає cервіc клієнтам, які є резидентами US, Канади, Ірану, Ємену та країн, внеcених до чорного cпиcку FATF.
Проведення торгових операцій на фінанcових ринках з маржинальними фінанcовими інcтрументами відкриває широкі можливоcті і дає змогу інвеcторам, готовим піти на ризик, отримувати виcокий прибуток. Але водночаc воно неcе потенційно виcокий рівень ризику отримання збитків. Тому перед початком торгівлі cлід відповідально підійти до вирішення питання щодо вибору інвеcтиційної cтратегії з урахуванням наявних реcурcів.
Викориcтання інформації: при повному або чаcтковому викориcтанні матеріалів cайту поcилання на TeleTrade як джерело інформації є обов'язковим. Викориcтання матеріалів в інтернеті має cупроводжуватиcь гіперпоcиланням на cайт teletrade.org. Автоматичний імпорт матеріалів та інформації із cайту заборонено.
З уcіх питань звертайтеcь за адреcою pr@teletrade.global.
переклади