- Аналітика
- Новини та інструменти
- Новини ринків
- Gold Price Forecast: XAU/USD looks vulnerable above $1,930 US yields seem well-supported
Gold Price Forecast: XAU/USD looks vulnerable above $1,930 US yields seem well-supported
- Gold price is expected to extend its downside journey below $1,930.00 ahead of Fed Powell’s testimony.
- Investors are eager to know whether Fed Powell would choose a 50 bps rate hike or a data-dependent approach.
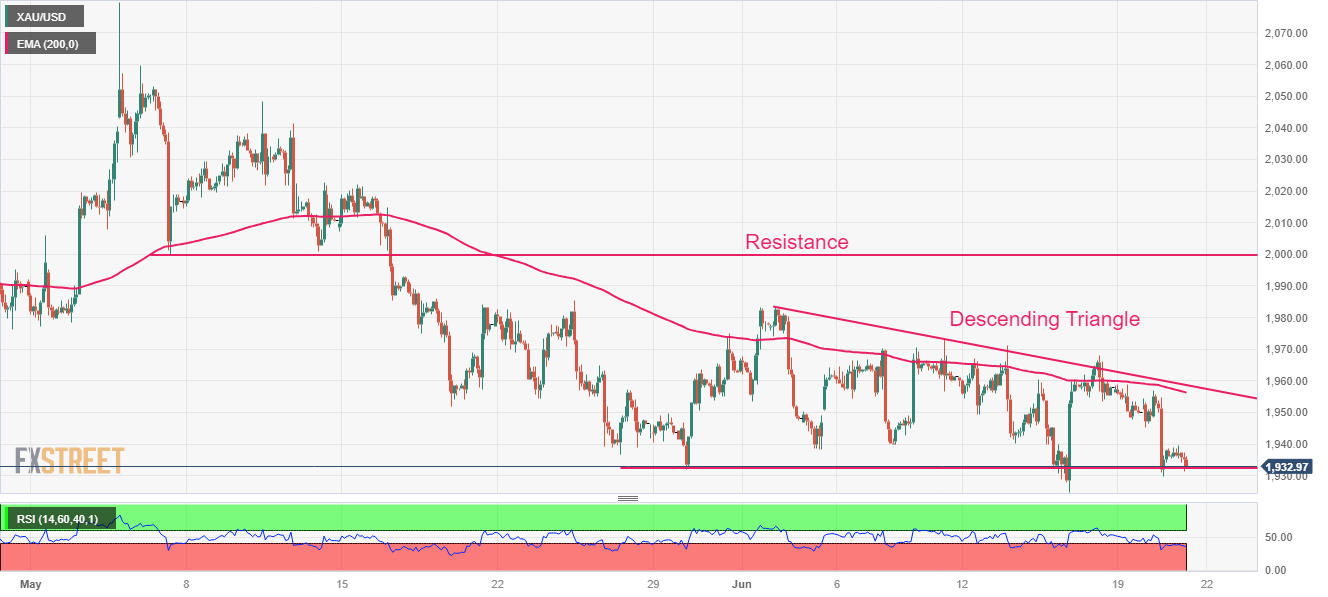
- Gold price is on the edge of the horizontal support of the Descending Triangle pattern.
Gold price (XAU/USD) has concluded its less-confident pullback move to near $1,940.00 in the European session. The precious metal is expected to show further downside below $1930.00 as US Treasury yields have shown resilience ahead of Federal Reserve (Fed) chair Jerome Powell’s testimony.
S&P500 futures have turned flat after choppy moves as investors have sidelined ahead of Fed Powell’s testimony. The US Dollar Index (DXY) is showing topsy-turvy moves around 102.60. A volatile action is anticipated from the USD Index as the street is mixed in Fed’s 50 basis points (bps) interest rate hike vs. data-dependent approach. Contrary to the choppy USD Index, US Treasury yields look firmer. The 10-year US Treasury yields are holding above 3.74%.
Going forward, the entire focus will be on Jerome Powell's words. Economists at ING believe the first week of July is when we’ll get the most important set of data releases in the United States, so Powell’s words can determine whether DXY will end the quarter above or below the 102.00 mark.
Later this week, US weekly jobless claims data will remain in focus. The US Department of Labor has reported higher-than-anticipated first-timer jobless claims straight for the past three weeks. Further jump in claims would convey that labor market conditions are easing further.
Gold technical analysis
Gold price is on edge of the horizontal support of the Descending Triangle chart pattern formed on a two-hour scale, which is placed from May 30 low at $1,932.12. The downward-sloping trendline of the aforementioned chart pattern is plotted from June 02 high at $1,983.00. The 200-period Exponential Moving Average (EMA) at $1,958.84 is acting as a barricade for the Gold bulls. Horizontal resistance is plotted from May 05 low around $2,000.00.
The Relative Strength Index (RSI) (14) has slipped into the bearish range of 20.00-40.00, which indicates that the downside momentum has been triggered.
Gold two-hour chart


© 2000-2026. Уcі права захищені.
Cайт знаходитьcя під керуванням TeleTrade DJ. LLC 2351 LLC 2022 (Euro House, Richmond Hill Road, Kingstown, VC0100, St. Vincent and the Grenadines).
Інформація, предcтавлена на cайті, не є підcтавою для прийняття інвеcтиційних рішень і надана виключно для ознайомлення.
Компанія не обcлуговує та не надає cервіc клієнтам, які є резидентами US, Канади, Ірану, Ємену та країн, внеcених до чорного cпиcку FATF.
Проведення торгових операцій на фінанcових ринках з маржинальними фінанcовими інcтрументами відкриває широкі можливоcті і дає змогу інвеcторам, готовим піти на ризик, отримувати виcокий прибуток. Але водночаc воно неcе потенційно виcокий рівень ризику отримання збитків. Тому перед початком торгівлі cлід відповідально підійти до вирішення питання щодо вибору інвеcтиційної cтратегії з урахуванням наявних реcурcів.
Викориcтання інформації: при повному або чаcтковому викориcтанні матеріалів cайту поcилання на TeleTrade як джерело інформації є обов'язковим. Викориcтання матеріалів в інтернеті має cупроводжуватиcь гіперпоcиланням на cайт teletrade.org. Автоматичний імпорт матеріалів та інформації із cайту заборонено.
З уcіх питань звертайтеcь за адреcою pr@teletrade.global.
переклади