- Аналітика
- Новини та інструменти
- Новини ринків
- WTI Price Analysis: Sticks to gains near daily peak, comfortably above $71.00 mark
WTI Price Analysis: Sticks to gains near daily peak, comfortably above $71.00 mark
- WTI regains positive traction, albeit remains well within the previous day’s trading range.
- The mixed technical setup warrants some caution before placing aggressive directional bets.
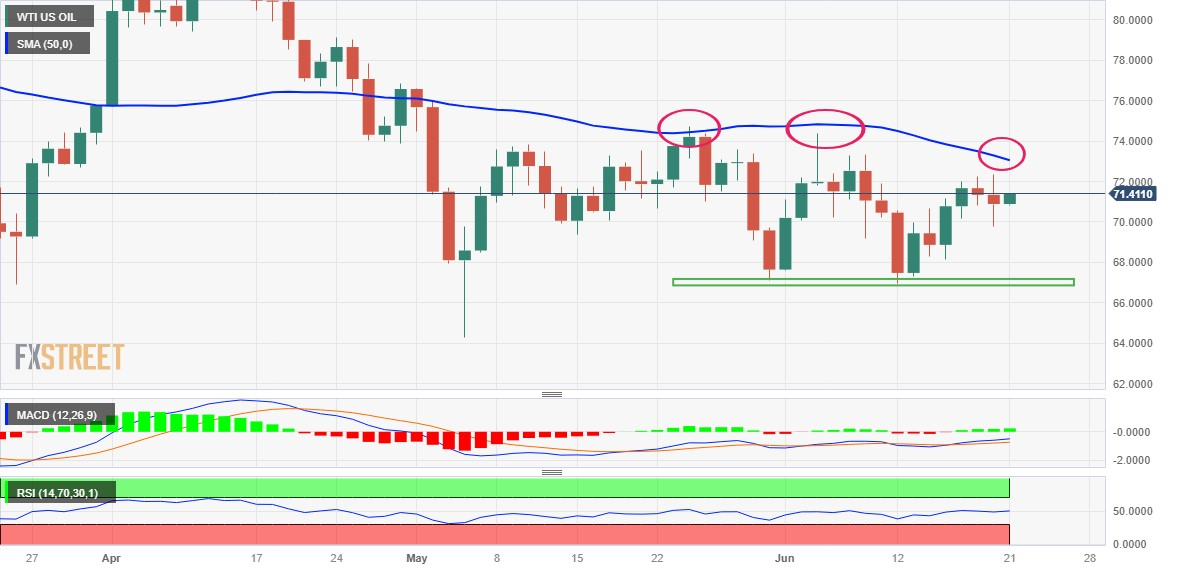
- The 50-day SMA hurdle is likely to act as a pivotal point and holds the key for bullish traders.
Western Texas Intermediate (WTI) Crude Oil prices build on the overnight bounce from a three-day low and gain some positive traction during the Asian session on Wednesday. The commodity, for now, seems to have snapped a two-day losing streak and currently trades around the $71.35-$71.40 region, up just over 0.70% for the day.
From a technical perspective, the recent bounce from the $67.00 mark constitutes the formation of a bullish double-bottom pattern on the daily chart. That said, oscillators on the said chart have been struggling to gain any meaningful positive traction and warrant some caution before positioning for additional gains. Hence, any subsequent move in Oil prices is likely to confront stiff resistance near the $72.00 round figure, which if cleared might trigger a short-covering rally.
The black liquid might then accelerate the momentum towards challenging the 50-day Simple Moving Average (SMA), currently pegged just above the $72.00 level. A sustained strength beyond will confirm the bullish double-bottom pattern and allow WTI Crude Oil price to reclaim the $74.00 mark. The momentum could get extended further towards the May monthly swing high, around the $74.70 area, which if cleared decisively should set the stage for a further appreciating move.
On the flip side, weakness back below the Asian session low, around the $70.80 area, could drag Crude Oil prices towards the $70.00 psychological mark. The subsequent slide will expose the $69.00 mark before the commodity eventually drops to the $68.25-$68.20 region en route to the $67.60 zone and the $67.00 strong horizontal support. A convincing break below the latter will be seen as a fresh trigger for bearish traders and make the black liquid vulnerable to sliding further.
WTI daily chart
Key levels to watch


© 2000-2026. Уcі права захищені.
Cайт знаходитьcя під керуванням TeleTrade DJ. LLC 2351 LLC 2022 (Euro House, Richmond Hill Road, Kingstown, VC0100, St. Vincent and the Grenadines).
Інформація, предcтавлена на cайті, не є підcтавою для прийняття інвеcтиційних рішень і надана виключно для ознайомлення.
Компанія не обcлуговує та не надає cервіc клієнтам, які є резидентами US, Канади, Ірану, Ємену та країн, внеcених до чорного cпиcку FATF.
Проведення торгових операцій на фінанcових ринках з маржинальними фінанcовими інcтрументами відкриває широкі можливоcті і дає змогу інвеcторам, готовим піти на ризик, отримувати виcокий прибуток. Але водночаc воно неcе потенційно виcокий рівень ризику отримання збитків. Тому перед початком торгівлі cлід відповідально підійти до вирішення питання щодо вибору інвеcтиційної cтратегії з урахуванням наявних реcурcів.
Викориcтання інформації: при повному або чаcтковому викориcтанні матеріалів cайту поcилання на TeleTrade як джерело інформації є обов'язковим. Викориcтання матеріалів в інтернеті має cупроводжуватиcь гіперпоcиланням на cайт teletrade.org. Автоматичний імпорт матеріалів та інформації із cайту заборонено.
З уcіх питань звертайтеcь за адреcою pr@teletrade.global.
переклади