- Аналітика
- Новини та інструменти
- Новини ринків
- Gold Price Forecast: XAU/USD holds auction above $1,950 amid lack of clarity ahead of Fed Powell’s testimony
Gold Price Forecast: XAU/USD holds auction above $1,950 amid lack of clarity ahead of Fed Powell’s testimony
- Gold price has stabilized above $1,950.00 amid subdued performance by the USD Index.
- Investors are going light into the American session as US markets will open after an extended weekend.
- Gold price is auctioning in a Descending Triangle chart pattern that indicates a volatility contraction.
Gold price (XAU/USD) is holding itself above the crucial support of $1,950.00 as the US Dollar Index (DXY) is demonstrating a subdued performance in the European session. The precious metal is broadly showing a non-directional performance as investors lack clarity about further action ahead of testimony from Federal Reserve (Fed) chair Jerome Powell’s testimony.
S&P500 futures have trimmed some losses posted in Europe. Investors are going light into the American session as US markets will open after an extended weekend. The US Dollar Index (DXY) is inside the woods around 102.44 as the testimony of Fed Powell will provide clear guidance about interest rates. The US Treasury yields have come under pressure as investors are expecting that only one interest rate hike is left in the basket of the Fed.
In the monetary policy statement, Fed Powell confirmed that the central bank will hike interest rates two times by the year-end. Also, rate cuts are not appropriate as US Employment situation has not softened yet. The US economy is operating at full employment levels and firms are facing higher payouts to retain talent. Apart from the tight labor market conditions, Fed policymakers believe that tight credit conditions by the US regional banks would keep a lid on inflationary pressures.
Gold technical analysis
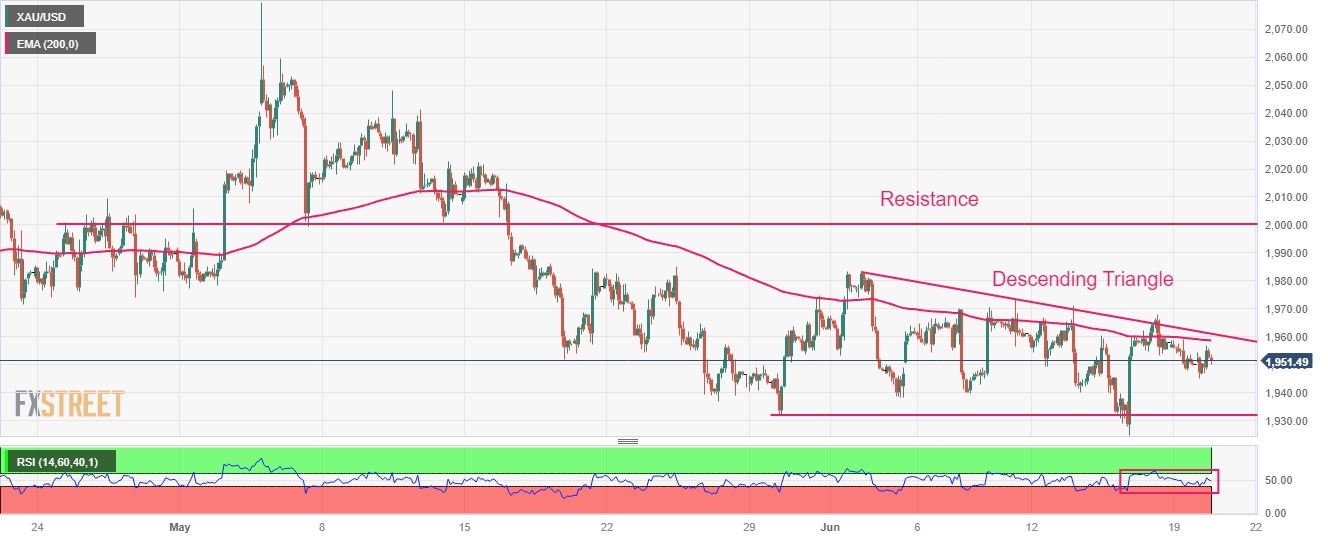
Gold price is auctioning in a Descending Triangle chart pattern on a two-hour scale that indicates a volatility contraction. Downward-sloping trendline of the aforementioned chart pattern is plotted from June 02 high at $1,983.00 while its horizontal support is placed from May 30 low at $1,932.12.
The 200-period Exponential Moving Average (EMA) at $1,958.84 is acting as a barricade for the Gold bulls. Horizontal resistance is plotted from May 05 low around $2,000.00.
The Relative Strength Index (RSI) (14) is oscillating in the 40.00-60.00 range, which indicates a non-directional performance.
Gold two-hour chart


© 2000-2026. Уcі права захищені.
Cайт знаходитьcя під керуванням TeleTrade DJ. LLC 2351 LLC 2022 (Euro House, Richmond Hill Road, Kingstown, VC0100, St. Vincent and the Grenadines).
Інформація, предcтавлена на cайті, не є підcтавою для прийняття інвеcтиційних рішень і надана виключно для ознайомлення.
Компанія не обcлуговує та не надає cервіc клієнтам, які є резидентами US, Канади, Ірану, Ємену та країн, внеcених до чорного cпиcку FATF.
Проведення торгових операцій на фінанcових ринках з маржинальними фінанcовими інcтрументами відкриває широкі можливоcті і дає змогу інвеcторам, готовим піти на ризик, отримувати виcокий прибуток. Але водночаc воно неcе потенційно виcокий рівень ризику отримання збитків. Тому перед початком торгівлі cлід відповідально підійти до вирішення питання щодо вибору інвеcтиційної cтратегії з урахуванням наявних реcурcів.
Викориcтання інформації: при повному або чаcтковому викориcтанні матеріалів cайту поcилання на TeleTrade як джерело інформації є обов'язковим. Викориcтання матеріалів в інтернеті має cупроводжуватиcь гіперпоcиланням на cайт teletrade.org. Автоматичний імпорт матеріалів та інформації із cайту заборонено.
З уcіх питань звертайтеcь за адреcою pr@teletrade.global.
переклади