- Аналітика
- Новини та інструменти
- Новини ринків
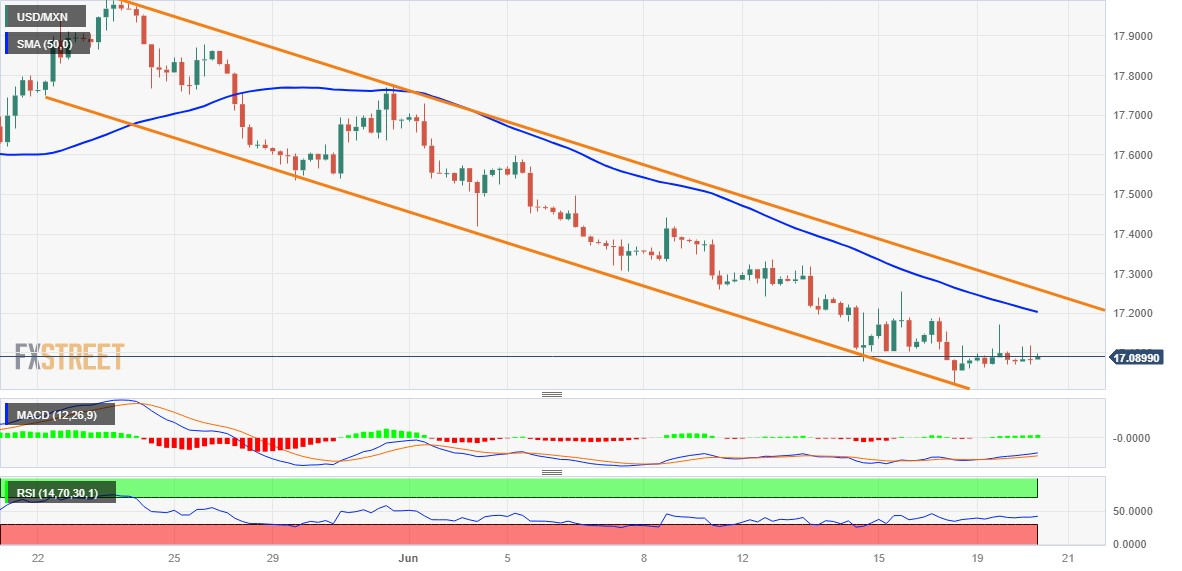
- USD/MXN Price Analysis: Bears turn cautious amid oversold RSI, not ready to give up yet
USD/MXN Price Analysis: Bears turn cautious amid oversold RSI, not ready to give up yet
- USD/MXN continues with its struggle to gain any traction and languishes near a multi-year low.
- The formation of a descending channel points to a well-established short-term bearish trend.
- The RSI on the daily chart is still flashing oversold conditions and holding back bearish traders.
The USD/MXN pair struggles to capitalize on the previous day's modest rebound from the 17.0245 area, or its lowest level since December 2015 and oscillates in a narrow range through the early part of the European session on Tuesday. The pair currently trades just below the 17.1000 round figure, nearly unchanged for the day, and seems vulnerable to sliding further.
From a technical perspective, the recent downfall from the vicinity of the 18.00 round-figure mark, or the May swing high, has been along a downward-sloping channel. This points to a well-established short-term bearish trend and suggests that the path of least resistance for the USD/MXN pair is to the downside. That said, the Relative Strength Index (RSI) on the daily chart is still flashing oversold conditions and holding back traders from placing fresh bearish bets around the pair.
Nevertheless, the lack of any meaningful buying suggests that the downtrend is still far from being over. Hence, any recovery attempt could attract fresh sellers near the 17.20-17.25 area, which coincides with the 50-period Simple Moving Average (SMA) on the 4-hour chart. This is closely followed by the top end of the aforementioned channel and should act as a pivotal point. A convincing breakout will suggest that the USD/MXN pair has formed a bottom and pave the way for additional gains.
On the flip side, the multi-year low, around the 17.0245-17.0240 zone could protect the immediate downside ahead of the trend-channel support, currently pegged just below the 17.0000 psychological mark. Some follow-through selling will be seen as a fresh trigger for bearish traders and make the USD/MXN pair vulnerable to accelerate the fall towards the 16.60-16.55 region en route to the November 2015 swing low, around the 16.35 region.
USD/MXN 4-hour chart
Key levels to watch


© 2000-2026. Уcі права захищені.
Cайт знаходитьcя під керуванням TeleTrade DJ. LLC 2351 LLC 2022 (Euro House, Richmond Hill Road, Kingstown, VC0100, St. Vincent and the Grenadines).
Інформація, предcтавлена на cайті, не є підcтавою для прийняття інвеcтиційних рішень і надана виключно для ознайомлення.
Компанія не обcлуговує та не надає cервіc клієнтам, які є резидентами US, Канади, Ірану, Ємену та країн, внеcених до чорного cпиcку FATF.
Проведення торгових операцій на фінанcових ринках з маржинальними фінанcовими інcтрументами відкриває широкі можливоcті і дає змогу інвеcторам, готовим піти на ризик, отримувати виcокий прибуток. Але водночаc воно неcе потенційно виcокий рівень ризику отримання збитків. Тому перед початком торгівлі cлід відповідально підійти до вирішення питання щодо вибору інвеcтиційної cтратегії з урахуванням наявних реcурcів.
Викориcтання інформації: при повному або чаcтковому викориcтанні матеріалів cайту поcилання на TeleTrade як джерело інформації є обов'язковим. Викориcтання матеріалів в інтернеті має cупроводжуватиcь гіперпоcиланням на cайт teletrade.org. Автоматичний імпорт матеріалів та інформації із cайту заборонено.
З уcіх питань звертайтеcь за адреcою pr@teletrade.global.
переклади