- Аналітика
- Новини та інструменти
- Новини ринків
- Gold Price Forecast: XAU/USD declines towards $1,950 as USD Index recovers ahead of Blinken-Jinping meet
Gold Price Forecast: XAU/USD declines towards $1,950 as USD Index recovers ahead of Blinken-Jinping meet
- Gold price has dropped to near $1,950.00 citing recovery signs in the USD Index.
- Investors are turning cautious ahead of US State of Secretary Antony Blinken meeting China’s President XI Jinping.
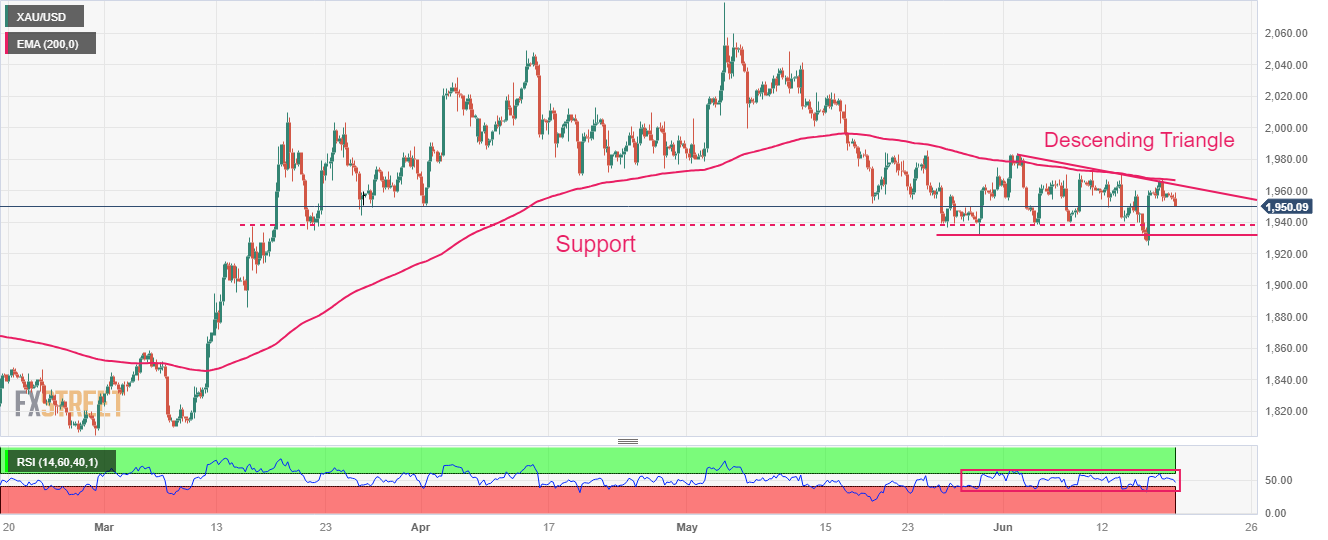
- Gold price has sensed selling pressure from the downward-sloping trendline of the Descending Triangle chart pattern.
Gold price (XAU/USD) has printed a fresh day’s low at $1,952.00 as the US Dollar Index (DXY) has attempted a recovery in the European session. The precious metal is declining towards the crucial support of $1,950.00 as investors are turning cautious ahead of US State of Secretary Antony Blinken's meeting with China’s President XI Jinping.
S&P500 futures are showing nominal gains after recovery losses posted in Asia, which indicates that appeal for US equities is still solid. Investors should note that the overall market mood could turn quiet as US markets will remain closed on Monday on account of Juneteenth.
The US Dollar Index (DXY) has come out of the woods and has climbed to near 103.53. There is a silver line between Federal Reserve’s (Fed) guidance and the expectations of investors for interest rates. Fed Chair Jerome Powell has announced that two small rate hikes are appropriate this year while the street is expecting that the central bank will go with just one hike. United States core inflation is still persistent and labor market conditions are extremely tight, having the potential of denting current expectations.
Elevating caution in the FX domain has also uplifted US Treasury Yields. The yields offered on 10-year US government bonds have jumped above 3.8%.
Gold technical analysis
Gold price has sensed selling pressure from the downward-sloping trendline of the Descending Triangle chart pattern plotted from June 02 high at $1,983.50 on a four-hour scale. The horizontal support is placed from May 30 low at $1,932.12. The broader cushion is placed from March 15 high at $1,937.39.
The 200-period Exponential Moving Average (EMA) at $1,966.70 is acting as a barricade for the Gold bulls, which indicates that the long-term trend is bearish.
Meanwhile, the Relative Strength Index (RSI) (14) is oscillating in the 40.00-60.00 range, portraying a lackluster performance.
Gold four-hour chart


© 2000-2026. Уcі права захищені.
Cайт знаходитьcя під керуванням TeleTrade DJ. LLC 2351 LLC 2022 (Euro House, Richmond Hill Road, Kingstown, VC0100, St. Vincent and the Grenadines).
Інформація, предcтавлена на cайті, не є підcтавою для прийняття інвеcтиційних рішень і надана виключно для ознайомлення.
Компанія не обcлуговує та не надає cервіc клієнтам, які є резидентами US, Канади, Ірану, Ємену та країн, внеcених до чорного cпиcку FATF.
Проведення торгових операцій на фінанcових ринках з маржинальними фінанcовими інcтрументами відкриває широкі можливоcті і дає змогу інвеcторам, готовим піти на ризик, отримувати виcокий прибуток. Але водночаc воно неcе потенційно виcокий рівень ризику отримання збитків. Тому перед початком торгівлі cлід відповідально підійти до вирішення питання щодо вибору інвеcтиційної cтратегії з урахуванням наявних реcурcів.
Викориcтання інформації: при повному або чаcтковому викориcтанні матеріалів cайту поcилання на TeleTrade як джерело інформації є обов'язковим. Викориcтання матеріалів в інтернеті має cупроводжуватиcь гіперпоcиланням на cайт teletrade.org. Автоматичний імпорт матеріалів та інформації із cайту заборонено.
З уcіх питань звертайтеcь за адреcою pr@teletrade.global.
переклади